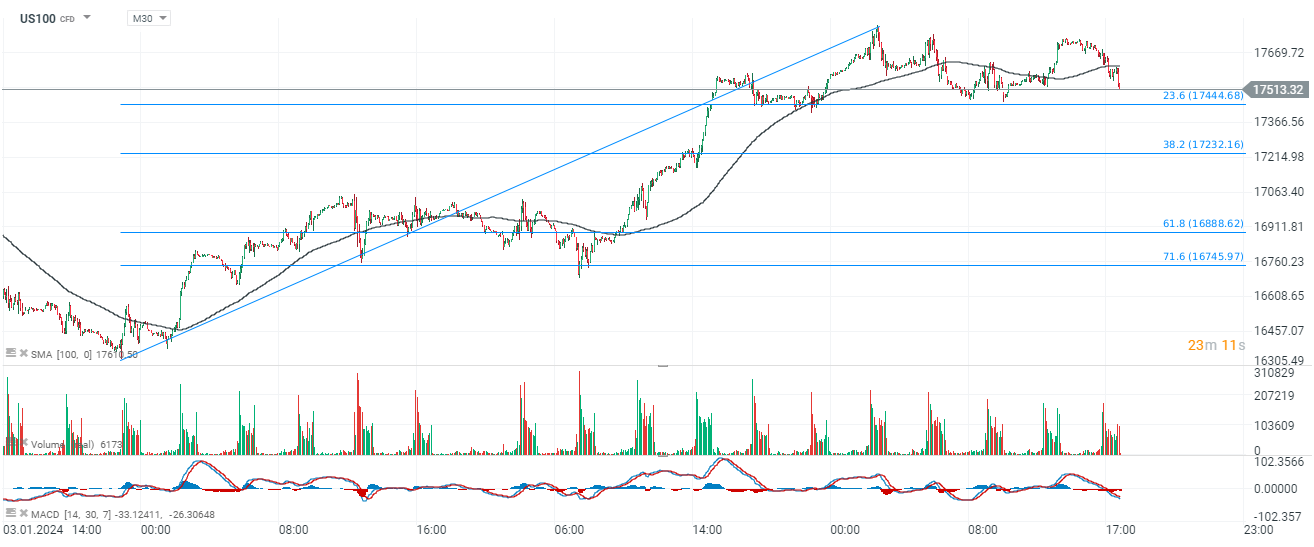
Wall Street futures decline despite better than expected Q4 2023 results of Big Tech stocks. Both reports of Microsoft and Alphabet (especially Microsoft, due to AI) were strong, but the profit taking pressure persist as earnings were not good enough to drive stock market sentiments much higher from current levels. Earnings of Big Tech were better than expected on almost any measure, while AMD report surprised with 'only' revenues beating expectations. Of course, on the final reaction to earnings, we may have to wait until tomorrow's market open.
Alphabet (GOOGL.US)
Shares lose 4% after earnings, not guidance provided in the report. Weaker search revenue, improvement in Google Cloud
Revenue: $86.31B vs $85.36B exp.
Earnings per share (EPS): $1.64 vs $1.59 exp.
- Google advertising: $65.52B vs $65.8B exp. (13% YoY)
- Google Cloud: $9.19B vs $8.95B exp. (26% YoY vs 23% exp. and 22.5% YoY in Q3 2023)
- YouTube: $9.20B vs $9.16B exp. (15.5% YoY)
- Google Services: $76.31B vs $75.97B exp.
- Other revenue: $657M vs $298.6M exp
- Free cash flow (FCF): $8B vs $15.9B exp.
- Traffic acquisition costs: $16.9B (8% YoY)
- Net income: 20.7B (51% YoY)
- Operating income: $23.70B vs $23.82B exp.
- Google Services operating income: $26.73B vs $25.75B exp.
- Google Cloud operating income $864M vs $427.4M exp.
- Operating margin 27% vs 27.7% exp.
- EBIT Margin: 30.5% YoY growth vs 30.5% YoY exp.
- Capital expenditure $11.02B vs $9.82B exp.
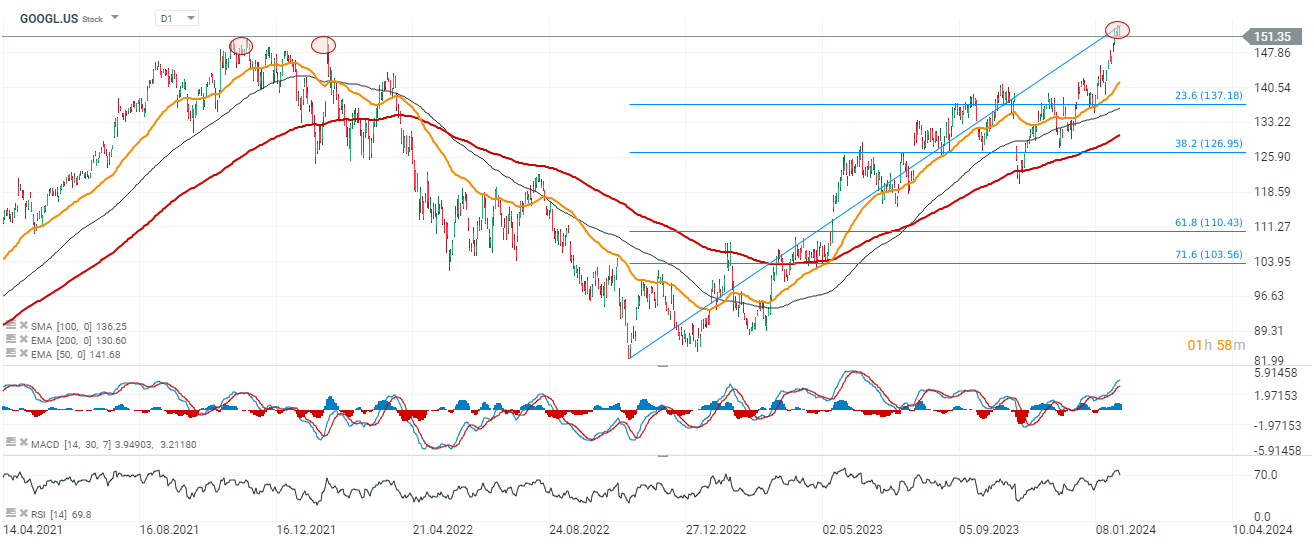
Alphabet earnings were strong, with very strong services and Google Cloud. Markets will await, especially on AI guidance and future expectations for cloud computing, on scheduled earnings call with analysts. Advertising revenues were very strong but slightly lower than expected, signalizing cyclical headwinds for broader advertising sector (especially in case of recession, which for now is not the basic scenario in the face off 'soft landing' expectations). Google Cloud dynamics was better than expected but still slower than Microsoft's Azure. Cash flow came in almost 50% lower than expected, probably due to tax assets value (almost $10 billion).
 Source: xStation5
Microsoft (MSFT.US)
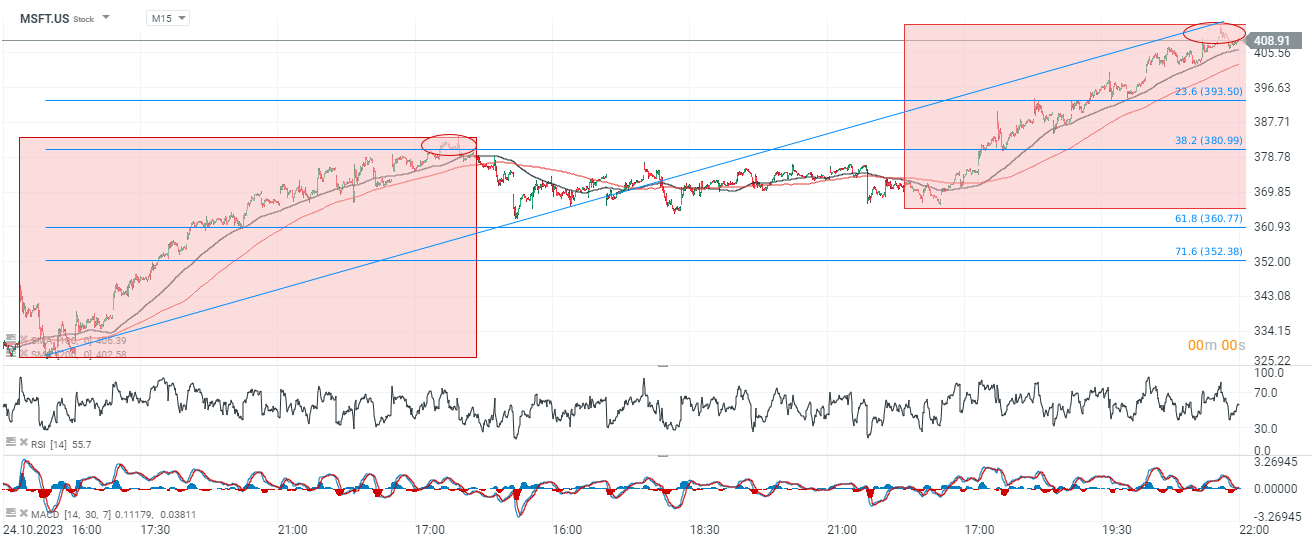
Shares traded flat after results, the company yet to provide more information. According to CEO's comments, corporate interest in Copilot platform increased 80% QoQ. Azure shows 30% YoY growth (more than Google Cloud)
Revenue: $62.02B vs $61.14B exp (at constant currency +16% YoY)
Earnings per share (EPS): $2.93 vs $2.78 exp.
- Productivity and Business Processes revenue $19.25B vs $19.03B exp. (13% YoY)
- Cloud revenue: $33.7B vs $32.12B exp.
- Intelligent cloud (Azure): $25.88B vs $25.29B exp. (30% YoY)
- Personal computing revenue: $19.2B (19% YoY)
- Net income: $21.9 (38% YoY)
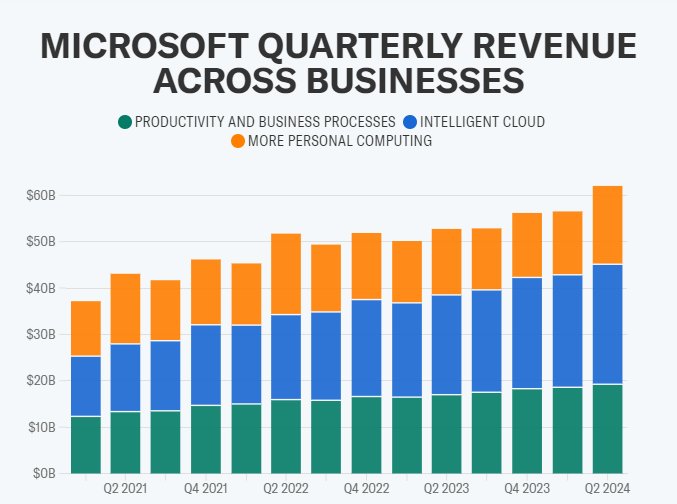
More cloud revenues in Microsoft business boost net earnings and margins. Source: Yahoo Finance
Microsoft posted its strongest revenue growth since 2022, driven by interest in new AI products outperforming revenues expectations as well as Alphabet, but even 8% higher EPS was not enough to support a strong stock bounce after a huge rally. Intelligent cloud revenues from Azure (which boost net revenues due to higher cloud business margins) were much higher than expected, with scale which outperformed positive surprise in Google Cloud, signaling that Microsoft cloud computing market share may hold the growing trend despite the rising number of competitors. Despite very strong Azure growth, cloud growth dynamics disappointed some Wall Street analysts.
 Source: xStation5
AMD (AMD.US)
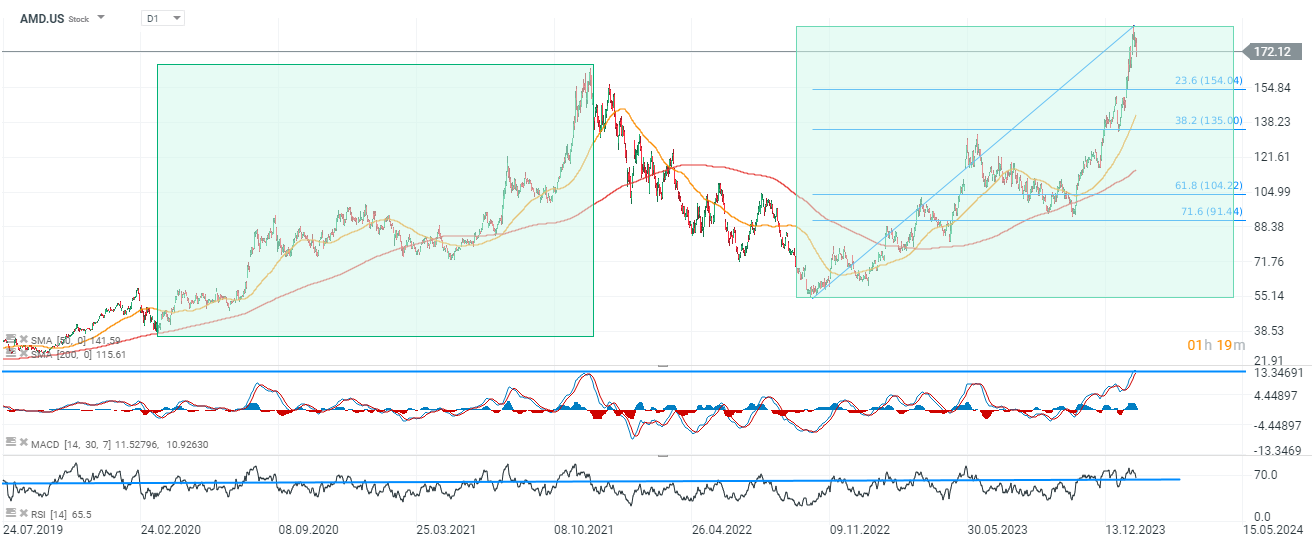
Shares gain almost 1% after earnings, more information on earnings call tomorrow. Shares lose more than 5% after results - visible improvement in data centers (DC), but not as spectacular as market expected. DC revenue at AMD up 7% vs. 20% y/y decline at Intel (INTC.US).
Revenue: $6.2B vs $6.13B exp.
Earnings per share (EPS): $0.77 vs $0.77 exp.
- Data center (DC): $2.28B vs $2.3B exp. (38% YoY, 43% QoQ, 2% below company forecasts; DC share in AMD earnings is 38% now vs 28% in Q4 2022)
- Gaming revenue $1.37B vs $1.25B exp. (-17% YoY)
- Client revenue: $1.46B vs $1.51B exp. (62% y/y)
- Embedded revenue: $1.06B vs $1.06B exp. (-24% YoY)
- Free cash flow: $242M vs $1.73B exp. (-45% YoY)
- Adjusted gross margin: 51% vs. 51.5% exp. (51% YoY)
- Capital expenditure: $139M vs EST $120.8M (12% YoY)
- Operating margin: 23% vs 23.2% exp
- R&D expenses: $1.51 vs $1.52 exp.
- Adjusted operating income: 1.41B vs $1.43B exp.
Company sees Q1 2024 revenues $5.1B to $5.7B with gross margin about 52% vs 51.8% exp. reaffirming 'strong' positioning for product ramp i 2024. AMD expects data center revenues to be flat sequentially. Falling cash flow and only slighlty higher than expected EPS are definitely not bullish for AMD, but markets await to hear more from the company on an earnings call scheduled tomorrow. Especially guidance on AI chip MI 300 sales in 2024 will be highly anticipated with expectations from $2B (from company 2023 Q3 guidance) to even more than $6B, citing by Susquehanna International clients. Datar center revenues were slightly lower than expected but still much higher YoY.
US100 (M30 interval)
 Source: xStation5

NFP preview

Economic calendar: NFP data and US oil inventory report 💡

Daily summary: Weak US data drags markets down, precious metals under pressure again!

Datadog in Top Form: Record Q4 and Strong Outlook for 2026
This content has been created by XTB S.A. This service is provided by XTB S.A., with its registered office in Warsaw, at Prosta 67, 00-838 Warsaw, Poland, entered in the register of entrepreneurs of the National Court Register (Krajowy Rejestr Sądowy) conducted by District Court for the Capital City of Warsaw, XII Commercial Division of the National Court Register under KRS number 0000217580, REGON number 015803782 and Tax Identification Number (NIP) 527-24-43-955, with the fully paid up share capital in the amount of PLN 5.869.181,75. XTB S.A. conducts brokerage activities on the basis of the license granted by Polish Securities and Exchange Commission on 8th November 2005 No. DDM-M-4021-57-1/2005 and is supervised by Polish Supervision Authority.


