FOMC minutes release at 7:00 pm BST is a top event of the day. Markets will look for hints on a pace of looming quantitative tightening and content of the document may have a big impact on markets, including indices. Commodity traders will focus on DOE report at 3:30 pm BST. Let's take a look at DE30, OIL and US100.
DE30
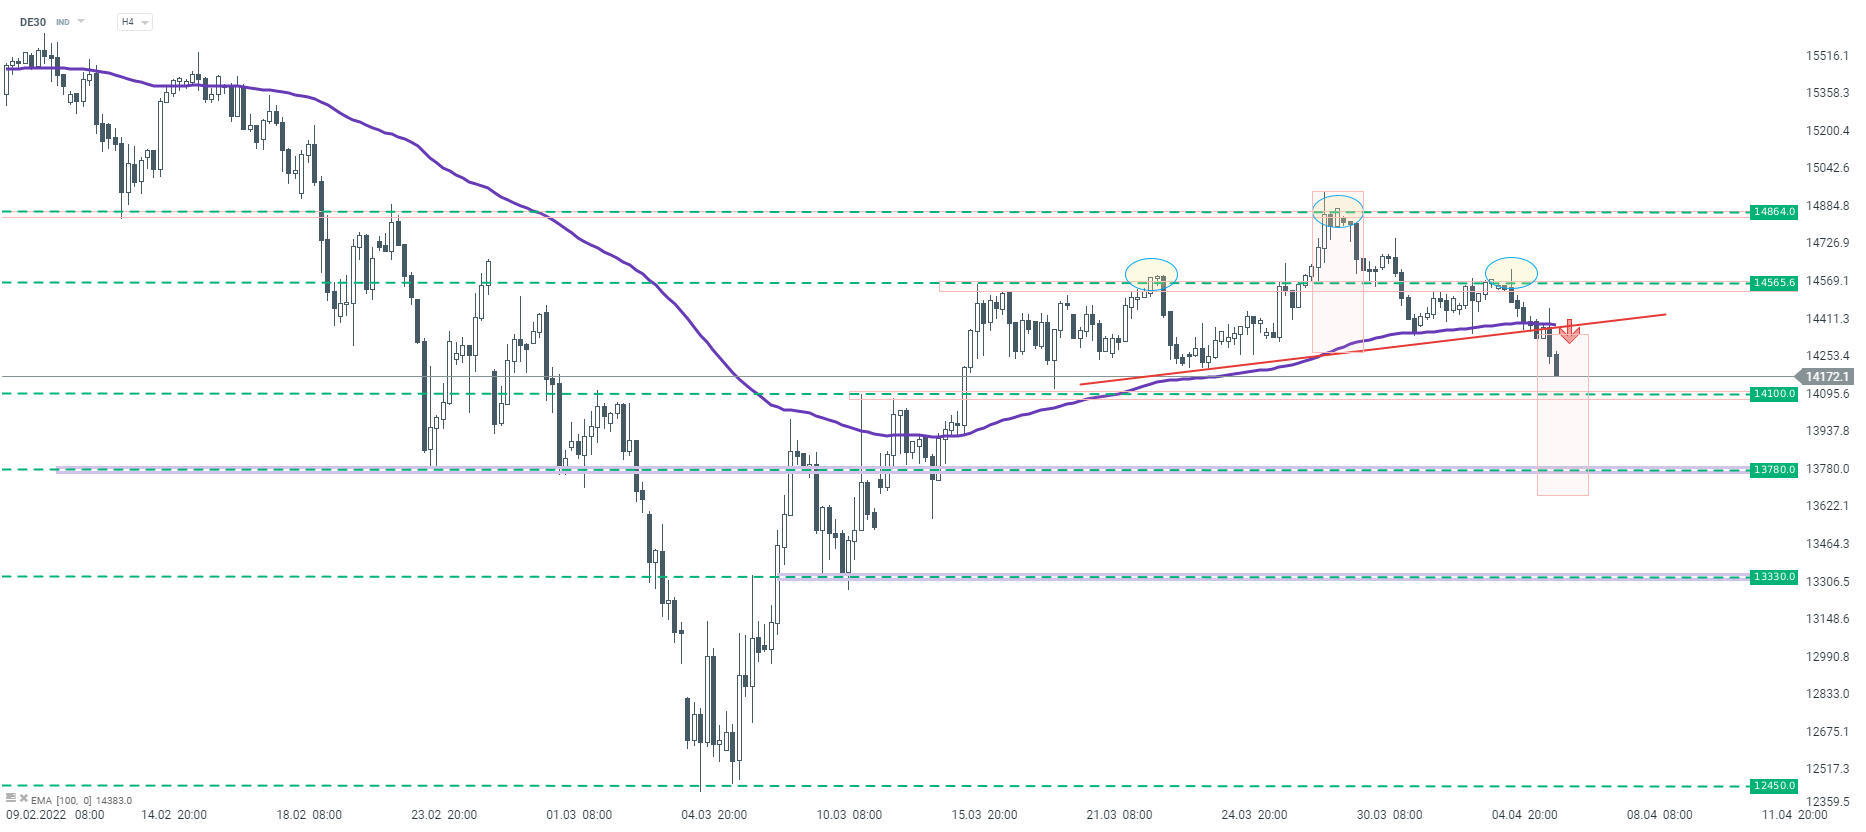
Let’s start today’s analysis with the German DAX (DE30). Looking at the H4 interval, one can see that the head and shoulders pattern surfaced on the chart. Taking this into account, the continuation of a downward move is possible. According to the classic technical analysis, as long as the price sits below the neckline of the aforementioned formation (red line on the chart below), the market bearss are at advantage. Considering the bearish scenario, the nearest support can be found at 14,100 pts where previous price reactions are located. In case of a bigger sell-off, the area at 13,780 pts should be considered the next support.
 DE30 H4 interval. Source: xStation5
Please be aware that the presented data refers to the past performance data and as such is not a reliable indicator of future performance.
OIL
Next, let’s look at the oil market. Oil price is stuck in a local consolidation move. Looking at the chart on the H1 interval, we can see that buyers managed to keep the price above the $103.40 per barrel. Nevertheless, they did not manage to break through the resistance at $112.00. As long as the price remains between the aforementioned levels, the base scenario is for continuation of a sideways move. Breakout will determine the direction of the next big move.
OIL H1 Source: xStation5
Please be aware that the presented data refers to the past performance data and as such is not a reliable indicator of future performance.
US100
Last but not least, let’s take a look at the US100 chart. US index has been trading in an upward move recently. However, the upward momentum weakened at the end of March and downward correction started. Currently we are observing an attempt to break through an important support zone at 14,670 - 14,725. However, if buyers manage to get the zone defended, resumption of an upward movement is possible. On the other hand, if a downward move deepens further, the next support to watch lies at the 14,380 pts, where the 38.2% Fibonacci retracement is located.
US100 H4 interval. Source: xStation
Please be aware that the presented data refers to the past performance data and as such is not a reliable indicator of future performance.

Daily Summary - Powerful NFP report could delay Fed rate cuts

BREAKING: Massive increase in US oil reserves!

US OPEN: Blowout Payrolls Signal Slower Path for Rate Cuts?

US jobs data surprises to the upside, and boosts stocks and pushes back Fed rate cut expectations
This content has been created by XTB S.A. This service is provided by XTB S.A., with its registered office in Warsaw, at Prosta 67, 00-838 Warsaw, Poland, entered in the register of entrepreneurs of the National Court Register (Krajowy Rejestr Sądowy) conducted by District Court for the Capital City of Warsaw, XII Commercial Division of the National Court Register under KRS number 0000217580, REGON number 015803782 and Tax Identification Number (NIP) 527-24-43-955, with the fully paid up share capital in the amount of PLN 5.869.181,75. XTB S.A. conducts brokerage activities on the basis of the license granted by Polish Securities and Exchange Commission on 8th November 2005 No. DDM-M-4021-57-1/2005 and is supervised by Polish Supervision Authority.


