FOMC minutes release is a key event of the day. Investors are eager to see whether US central bankers indeed began taper discussions during the most recent meeting or not. Having said that, an elevated volatility is expected across many markets in the evening. Let's take a look at the technical situation on EURUSD, GOLD and US500.
EURUSD
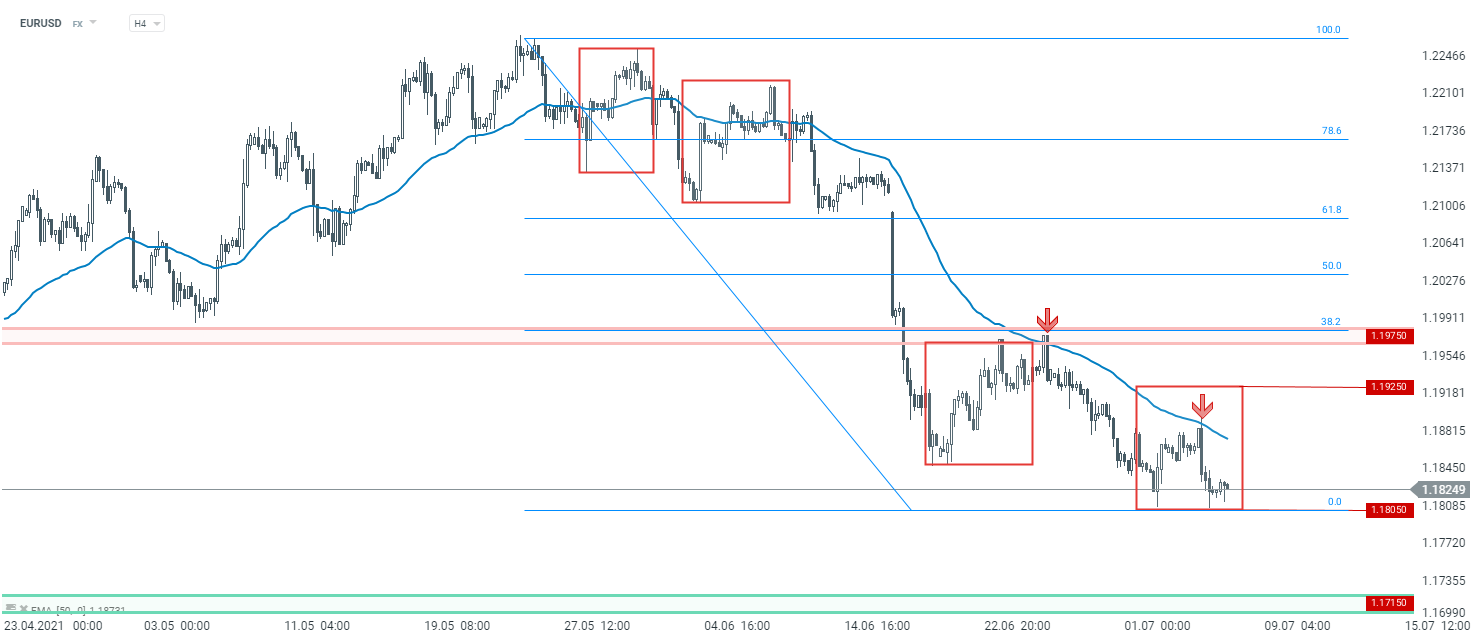
Let’s start today’s analysis with the major currency pair - EURUSD. Looking at the technical situation on H4 interval, one can see that market bears have been dominating for some time. The pair is trading slightly above the support at 1.1805, but the main sentiment remains downward. Should we see a break below, the next support to watch can be found at 1.1715. On the other hand, should buyers manage to halt downward movement here, upward correction may be launched. The recent correction reached the 100-period moving average and it should act as a key resistance in a short-term perspective. The next resistance to watch is 1.1925 where the upper limit of 1:1 structure is located.
 EURUSD H4 interval. Source: xStation5
Please be aware that the presented data refers to the past performance data and as such is not a reliable indicator of future performance.
GOLD
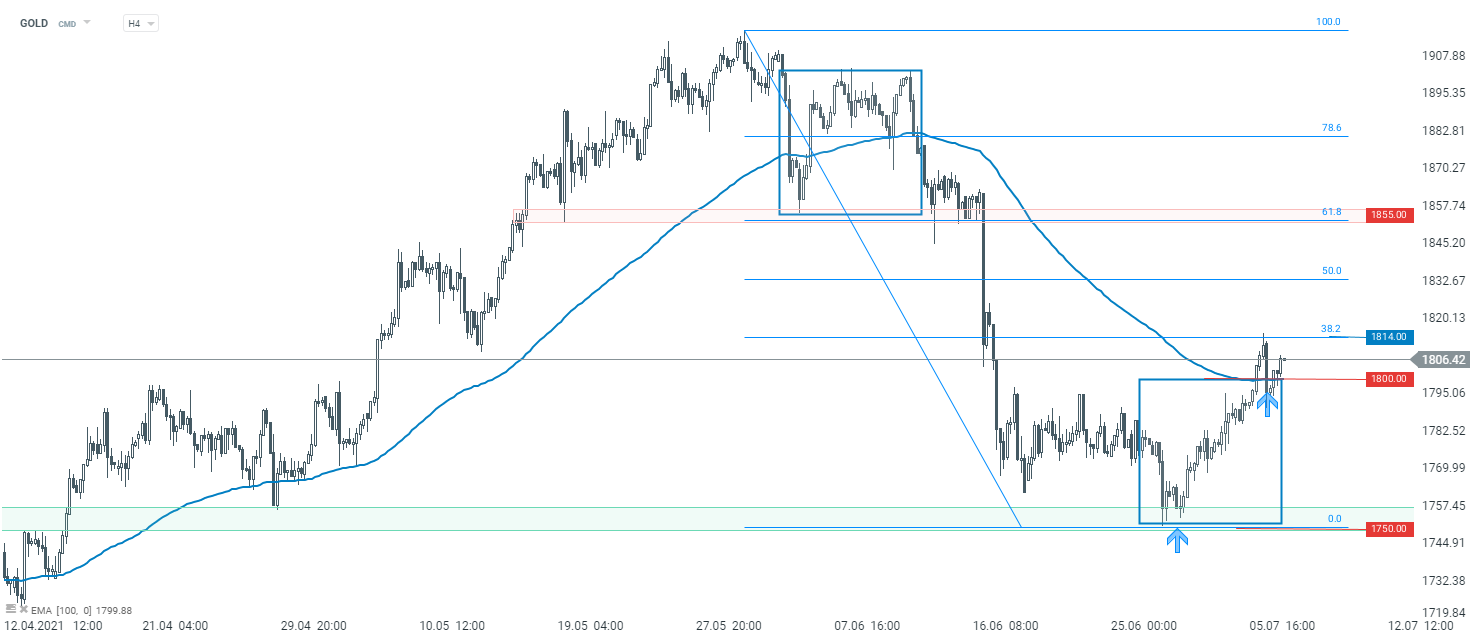
Next, let's take a look at the gold market. Analysing the chart on the H4 interval, one can see that the precious metal bounced off the key support area at $1,750. The buyers also managed to take the price above the upper limit of 1:1 structure, which according to the Overbalance strategy may herald a return to the upward trend. Should the current sentiment prevail, the upward move may extend towards the next resistance at $1,855. On the other hand, pulling back below the $1,800 may encourage market bears to be more active.
 GOLD H4 interval. Source: xStation5
Please be aware that the presented data refers to the past performance data and as such is not a reliable indicator of future performance.
US500
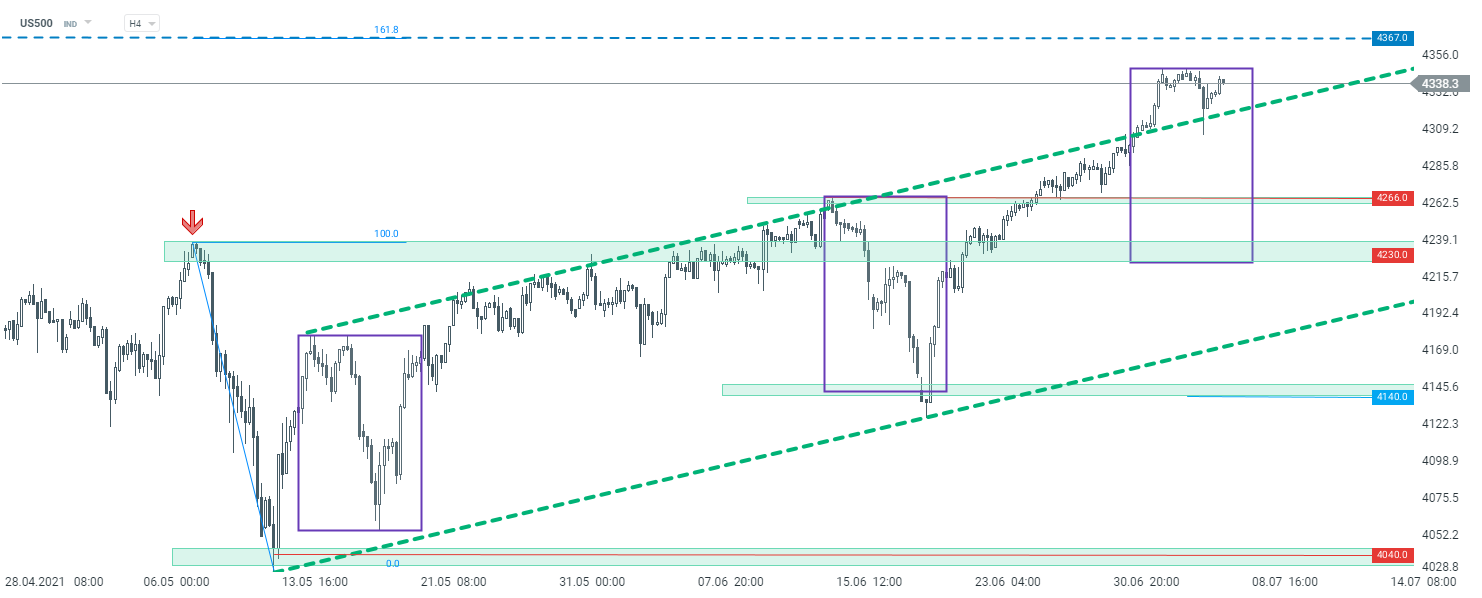
Last but not least, let's take a look at the US index - S&P 500 (US500). Looking at the H4 interval, one can see that the index again reached a fresh all time high this week. A sharp correction occurred yesterday after cash markets reopened after the long weekend. However, buyers quickly regained control and the price bounced off the upper limit of an earlier-broken upward channel, which should be considered a key support in the short-term perspective. Should buyers manage to maintain the current momentum, the 4,367 pts handle will be the potential target for market bulls. However, should the downward correction occur, the next support to watch is marked with a previous price reaction at 4,266 pts.
 US500 H4 interval. Source: xStation5
Please be aware that the presented data refers to the past performance data and as such is not a reliable indicator of future performance.

Daily summary: Silver plunges 9% 🚨Indices, crypto and precious metals under pressure

US100 loses 1.5% 📉

🚨Gold slumps 3% amid markets preparing for Chinese Lunar Year pause

Cocoa falls 2.5% to the lowest level since October 2023 📉
This content has been created by XTB S.A. This service is provided by XTB S.A., with its registered office in Warsaw, at Prosta 67, 00-838 Warsaw, Poland, entered in the register of entrepreneurs of the National Court Register (Krajowy Rejestr Sądowy) conducted by District Court for the Capital City of Warsaw, XII Commercial Division of the National Court Register under KRS number 0000217580, REGON number 015803782 and Tax Identification Number (NIP) 527-24-43-955, with the fully paid up share capital in the amount of PLN 5.869.181,75. XTB S.A. conducts brokerage activities on the basis of the license granted by Polish Securities and Exchange Commission on 8th November 2005 No. DDM-M-4021-57-1/2005 and is supervised by Polish Supervision Authority.


