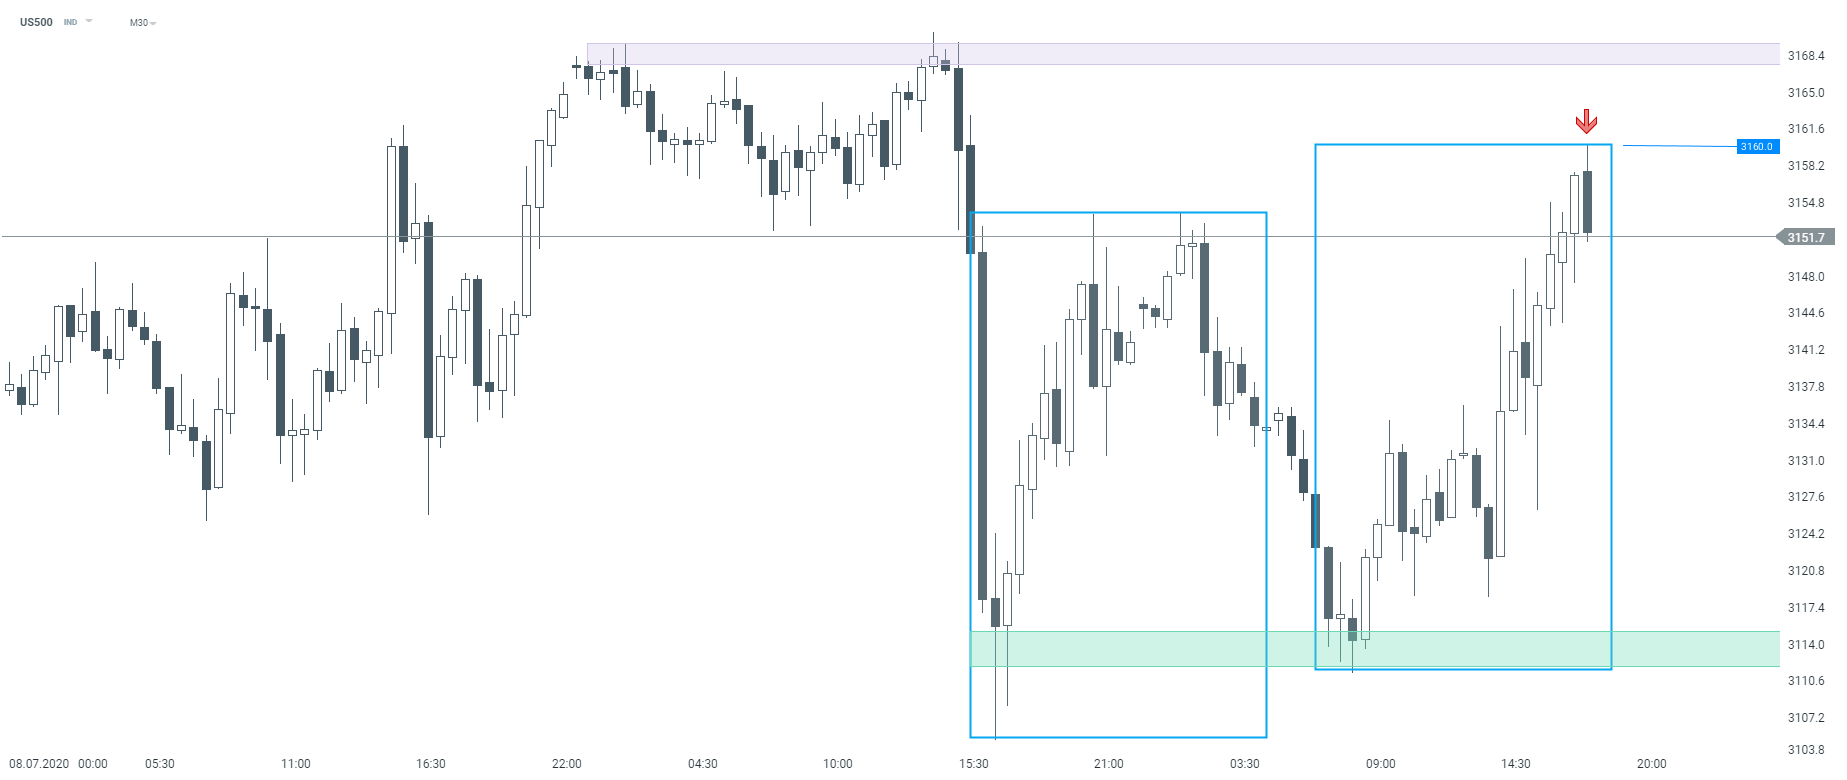
US500 is currently reacting to resistance level that results from 1:1 market geometry (3,160 pts). An upward move which was started at 7:30 am BST looks exactly the same as the one that started after 04:30 pm BST during yesterday’s trading. Should the current M30 candle close at current levels or below, today’s gains may be erased even further. Meanwhile CNBC reported that the index has formed its first ‘golden cross’ since April 2019 which in theory should be regarded as a bullish chart pattern.
 US500 M30 interval. Source: xStation5

Three markets to watch next week (09.02.2026)

US100 gains after the UoM report🗽Nvidia surges 5%

Market update: recovery takes hold, but investors remain on edge

Market wrap: European indices attempt a rebound after Wall Street’s record selloff 🔨
This content has been created by XTB S.A. This service is provided by XTB S.A., with its registered office in Warsaw, at Prosta 67, 00-838 Warsaw, Poland, entered in the register of entrepreneurs of the National Court Register (Krajowy Rejestr Sądowy) conducted by District Court for the Capital City of Warsaw, XII Commercial Division of the National Court Register under KRS number 0000217580, REGON number 015803782 and Tax Identification Number (NIP) 527-24-43-955, with the fully paid up share capital in the amount of PLN 5.869.181,75. XTB S.A. conducts brokerage activities on the basis of the license granted by Polish Securities and Exchange Commission on 8th November 2005 No. DDM-M-4021-57-1/2005 and is supervised by Polish Supervision Authority.


