Summary:
-
Gold moves up to trade at YTD high
-
Price above 1326 - highest since April 2018
-
Market on course for 3rd consecutive daily gain
There’s been a marked push higher in the price of Gold this afternoon, with the market moving above the high of 1326 seen at the end of January to trade at its highest level of the year. In fact, you have to go back to April 2018 to find a higher level for the precious metal. What is notable is the growing divergence between Gold and both the USD index and also the US stock market with the inverse correlation between both of these and Gold that was prominent in the last quarter of 2018, weakening significantly.
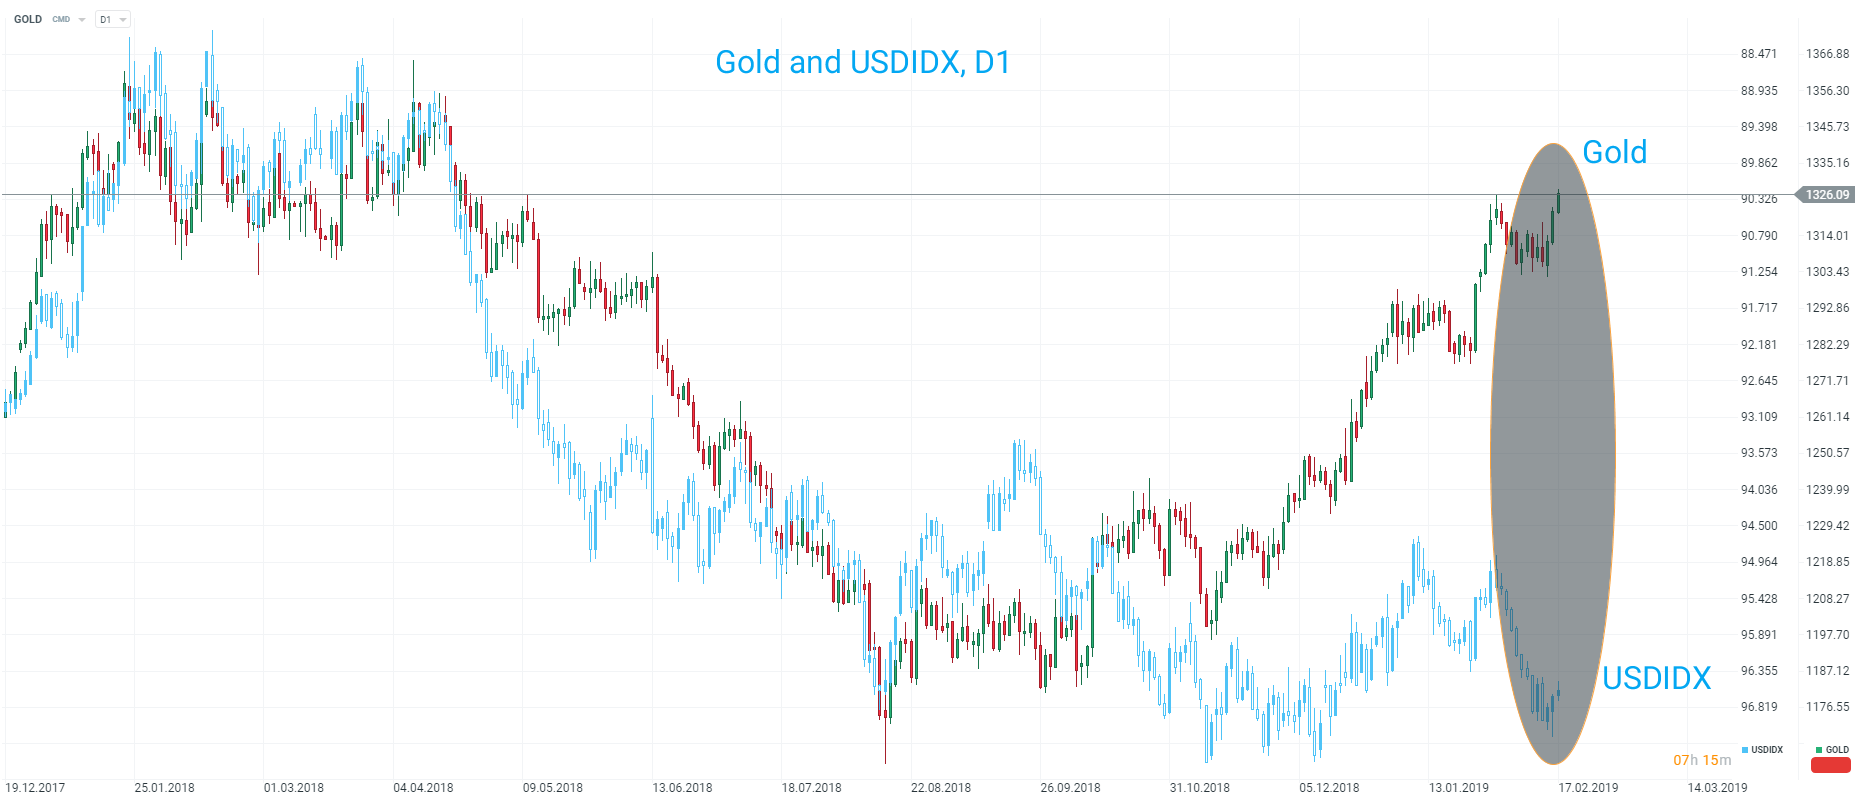
 Gold has moved up to its highest level since April 2018 today, with price looking to post a 3rd consecutive daily gain. Source: xStation
First off, let’s look at the US dollar and Gold. There’s an obvious reason why these two assets are inversely correlated, simply that Gold is priced in US dollar. Therefore any appreciation/depreciation in the greenback has a direct impact on the price of Gold in USD terms. When the price of Gold peaked around 1365 last year the USD index (USDIDX on xStation) traded around the 89 handle - significantly lower than where it is now (Note the USDIDX axis is inverted). A strengthening US dollar throughout the second and third quarter of 2018 coincided with a sustained drop in the price of gold, with the precious metal falling below the 1200 mark. What’s most interesting is the divergence which began around the end of October when Gold recovered strongly but the USDIDX didn’t pull back and remains around the 97 level.

There’s been a large divergence open up between the price of Gold and the USD index (axis inverted). The precious metal has rallied whilst the greenback has remained firm, likely due to risk-off flows seen in the latter part of 2018 as stock markets tumbled. Source: xStation
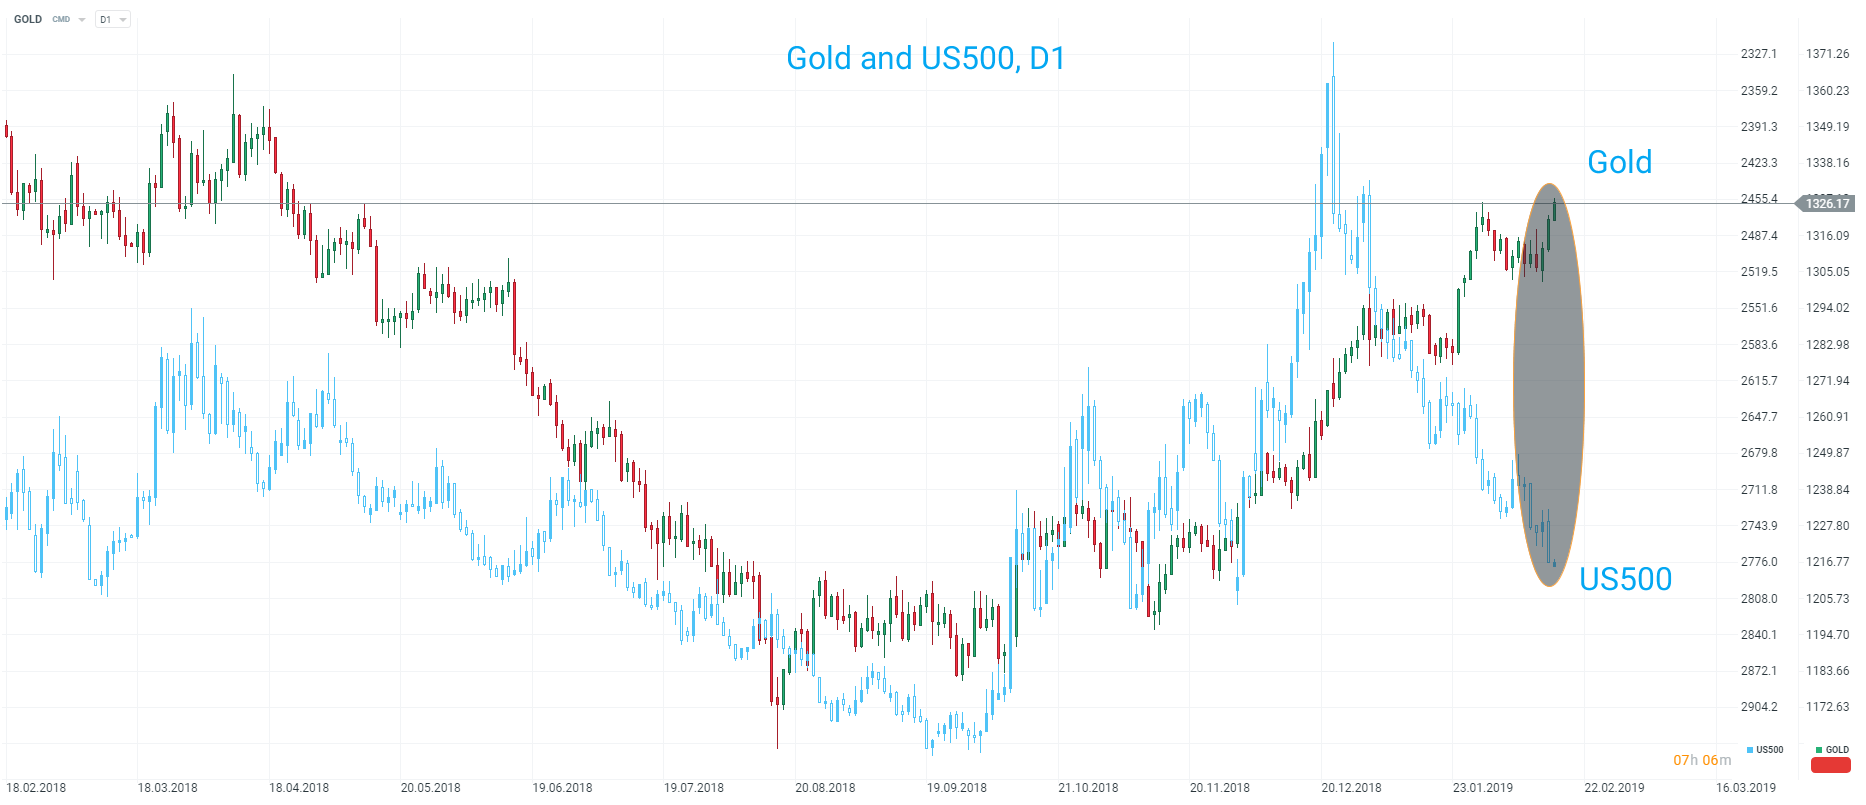
If this divergence between Gold and the US dollar came about due to risk-off moves then it seems logical to look at the relationship between Gold and the S&P500 (US500 on xStation). The inverse relationship over the same period hasn’t been quite as strong, but it is still apparent nonetheless with the price of Gold clearly benefiting when the stock market falls and vice versa. Or at least that was the case for most of last year, but again a divergence has opened up here. In the past couple of months there’s been a pretty impressive recovery in the S&P500, but at the same time Gold has also gained. There is a plausible explanation for this, with a clear dovish shift in the Fed providing a boost to both markets.

There’s a notable divergence of late between Gold and US stocks, with the inverse correlation previously seen clearly breaking down. Source: xStation
However, this theory is inconsistent with a persistently strong buck, as a more dovish central bank is typically seen to weigh on the domestic currency. Therefore, looking at the correlations of Gold, the US dollar and the S&P500 it seems as if something is a miss. If the divergence between Gold and the US dollar is due to risk-off flows then the S&P500 should be far lower. If the divergence between Gold and S&P500 is due to a dovish shift in the Fed then the US dollar could be expected to be far lower. One of these markets is clearly out of sync with the other two, the question however is which one is it?
 Gold and the US 10-year bond (TNOTE on xStation) typically exhibit a strong positive relationship and this has maintained itself for much of the past year. This could be seen to suggest that the price of Gold isn’t out of whack, rather it is the USDIDX or US500. Source: xStation
This content has been created by XTB S.A. This service is provided by XTB S.A., with its registered office in Warsaw, at Prosta 67, 00-838 Warsaw, Poland, entered in the register of entrepreneurs of the National Court Register (Krajowy Rejestr Sądowy) conducted by District Court for the Capital City of Warsaw, XII Commercial Division of the National Court Register under KRS number 0000217580, REGON number 015803782 and Tax Identification Number (NIP) 527-24-43-955, with the fully paid up share capital in the amount of PLN 5.869.181,75. XTB S.A. conducts brokerage activities on the basis of the license granted by Polish Securities and Exchange Commission on 8th November 2005 No. DDM-M-4021-57-1/2005 and is supervised by Polish Supervision Authority.


