USD gains after comments from Fed's Waller 🔎
The Eurodollar is recording declines, and futures contracts on US interest rates indicate less than a 60% chance of a Fed interest rate cut in March, compared to over 70% priced in before Christopher Waller's Fed speech.
Fed Waller
Start investing today or test a free demo
Open account Try demo Download mobile app Download mobile app- According to Fed projections, Waller assumes three 25 basis point cuts in 2024. This is more than half less than the market expects.
- A Fed member signaled that the Federal Reserve will not have to rush the pace of cuts if it decides on them.
- Waller advocates a cautious approach to premature cuts, emphasizing methodical and data-driven decisions.
- At the same time, in Waller's assessment, the Fed is closer today to achieving a sustainably lower, 2% inflation, although the timing and scale of cuts will depend on data.
- The current condition of the US economy gives the Federal Reserve the opportunity to not react and balance the risk of excessive tightening of policy, which should be avoided.
- There are still risks of a rebound in price pressure, but a slowdown in consumer activity is visible, which will be further illuminated by tomorrow's US retail sales readings (1:30 PM GMT).
The overall tone of Waller's remarks is not very hawkish but definitely does not support the 'dovish' expectations for 2024, which have solidified in recent months on Wall Street. Waller suggests rather methodical cuts, with which the Fed will not be overly rushed. As a result, we see the dollar appreciating and downward pressure on EURUSD, which records a decline of almost over 0.5%.
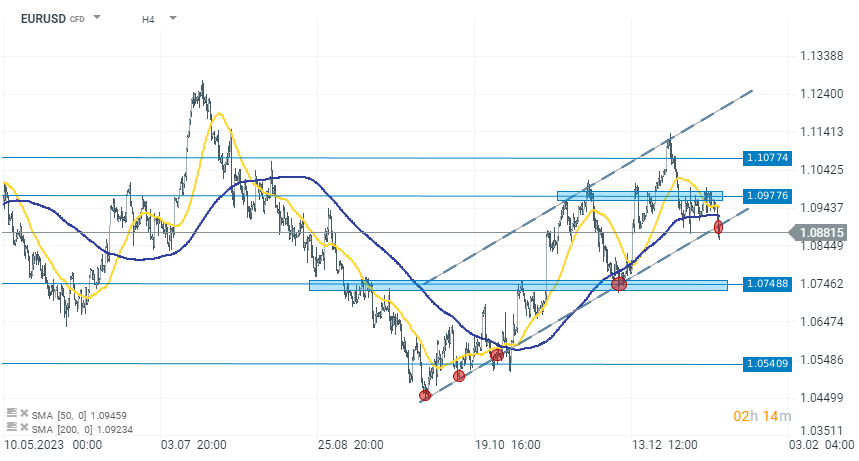
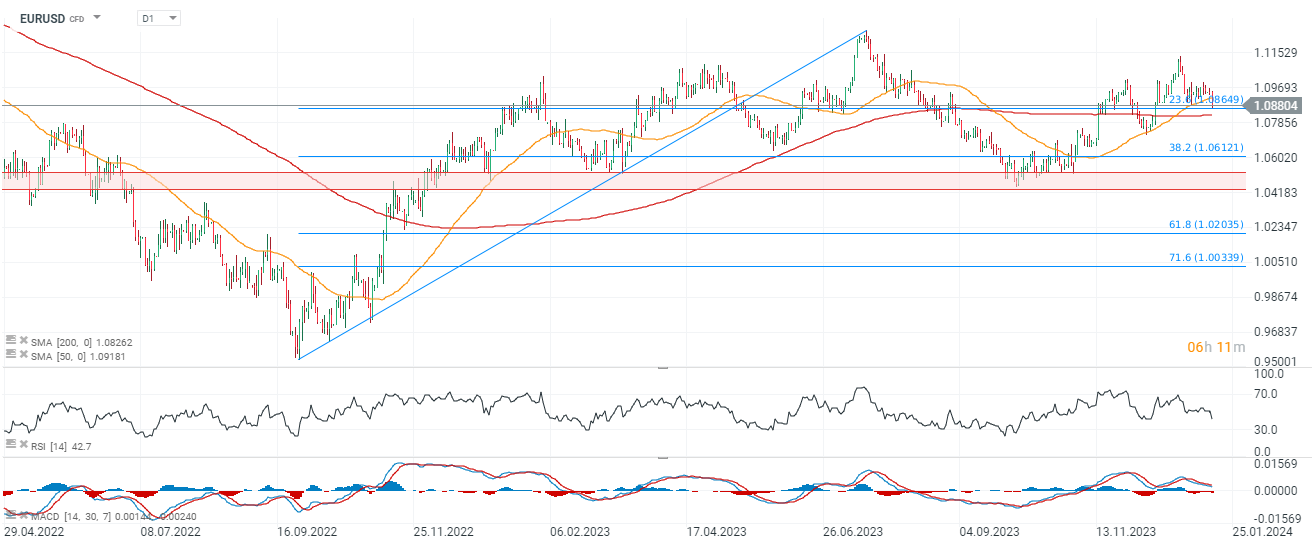
EURUSD (H4, D1 Interval)
H4 Interval: strong dollar in the last two weeks is exerting downward pressure on the EURUSD pair. On the chart, we see an attempt to break through the lower limit of the upward channel around the 1.08800 level. If the pressure is maintained, the next range will be levels in the 1.07500 zone, otherwise, for bulls, it will be crucial to defend the upward channel and return above the lower line.

Source: xStation 5
D1 Interval: looking at the EURUSD on the D1 chart, we see that the pair has reached a significant support point, which is the 23.6% Fibonacci retracement of the upward wave from autumn 2022. If the 1.087 level is maintained, a continuation of the upward trend is possible. On the other hand, a fall below 1.087 could indicate a test of the SMA200 (red line) and levels around 1.06, in case the support from the nearest Fibonacci retracement and the 200-week simple moving average prove too weak to withstand selling pressure. The key zone in the medium term appears to be around the 1.05 levels (horizontal, red line), below which a breakout could even suggest a retest of parity on EURUSD.

Source: xStation 5
This content has been created by XTB S.A. This service is provided by XTB S.A., with its registered office in Warsaw, at Prosta 67, 00-838 Warsaw, Poland, entered in the register of entrepreneurs of the National Court Register (Krajowy Rejestr Sądowy) conducted by District Court for the Capital City of Warsaw, XII Commercial Division of the National Court Register under KRS number 0000217580, REGON number 015803782 and Tax Identification Number (NIP) 527-24-43-955, with the fully paid up share capital in the amount of PLN 5.869.181,75. XTB S.A. conducts brokerage activities on the basis of the license granted by Polish Securities and Exchange Commission on 8th November 2005 No. DDM-M-4021-57-1/2005 and is supervised by Polish Supervision Authority.
