
The EUR/USD has retested a key support zone, which led to the cessation of the sell-off in the currency pair.
This support zone, identified at 1.07, has been supporting the price since November 2023 and may also be regarded as the lower boundary of the current medium-term consolidation.
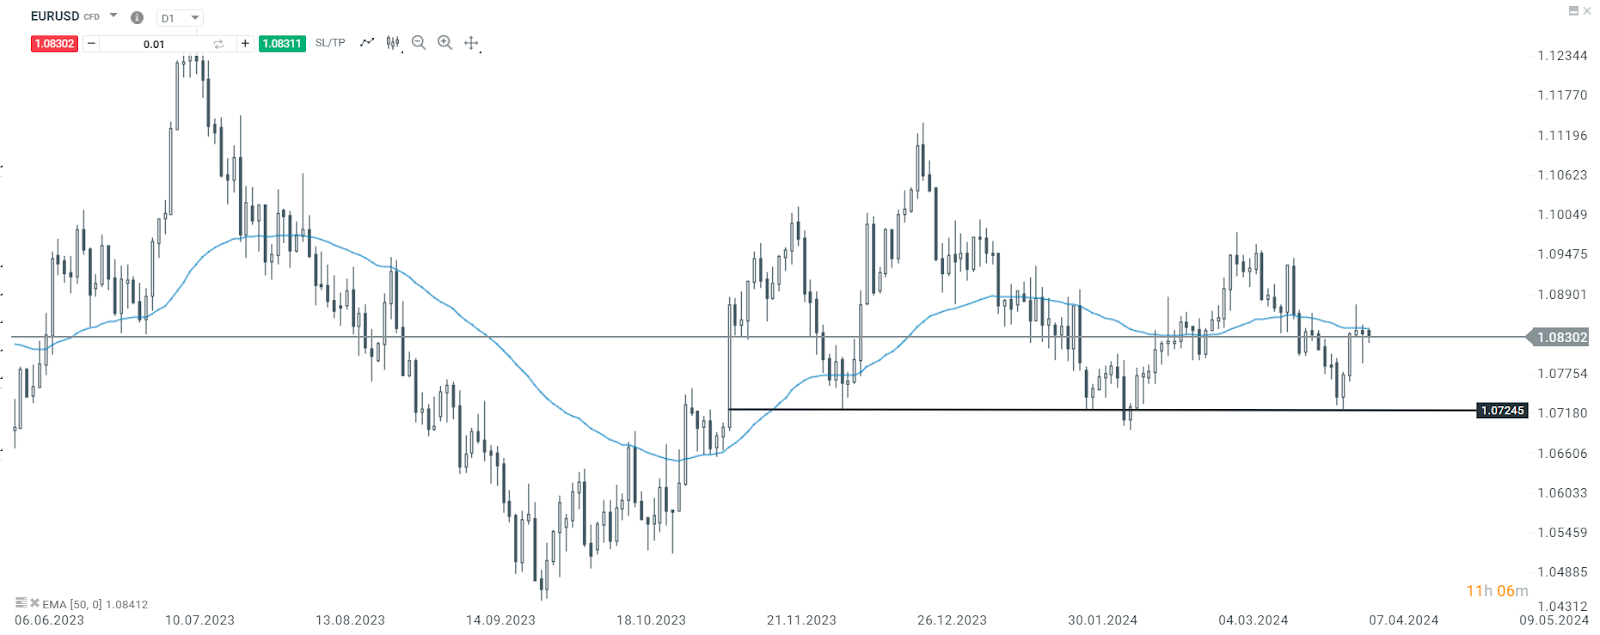
EUR/USD Daily time frame chart. Source: xStation 5
However, on the 4-hour chart, it's apparent that the price is approaching the first significant obstacle that could determine the next momentum in the pair. The downward trend line initiated at the end of February this year and has been extending since.
If buyers succeed in breaking above this zone, the upward movement could be prolonged. Conversely, if sellers regain control of the price at this juncture, a new downward trend cannot be discounted, potentially towards the 50-period EMA.
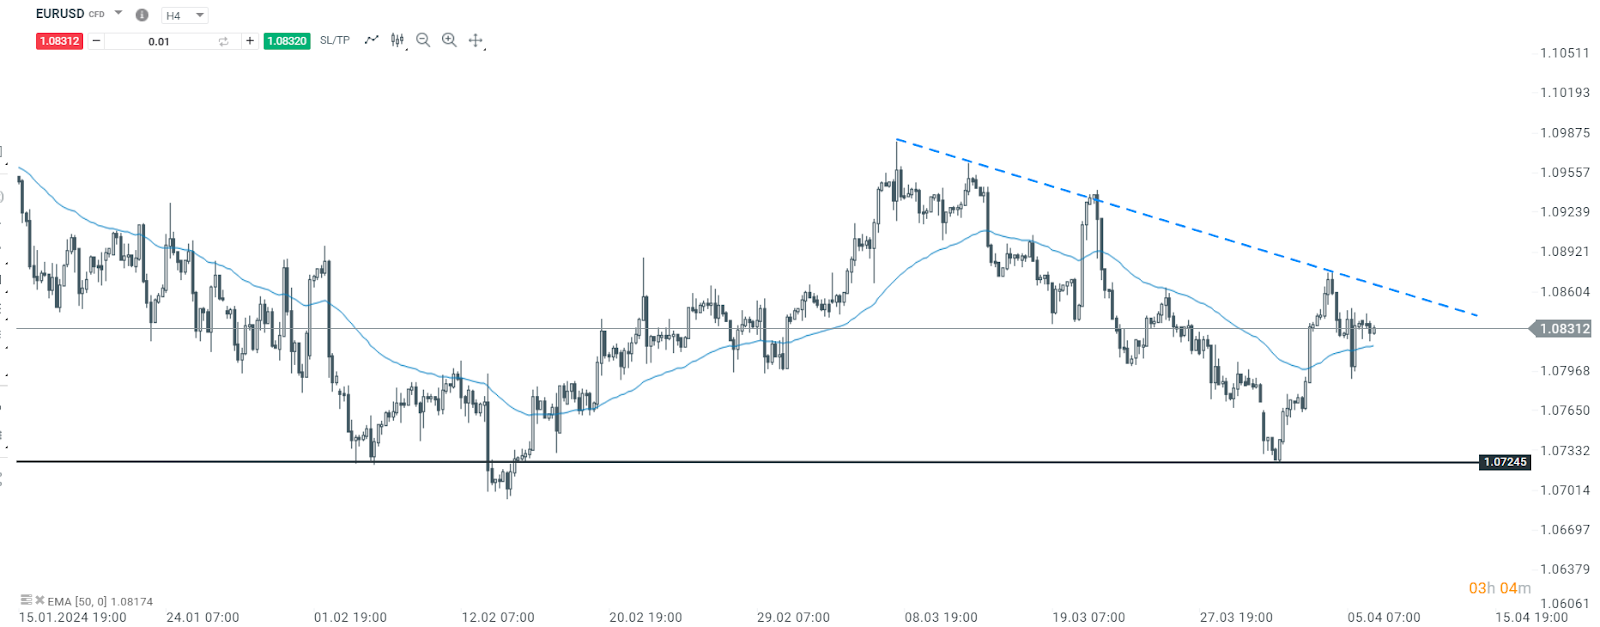
Eur/usd. 4 hours time frame chart. Source: xStation 5
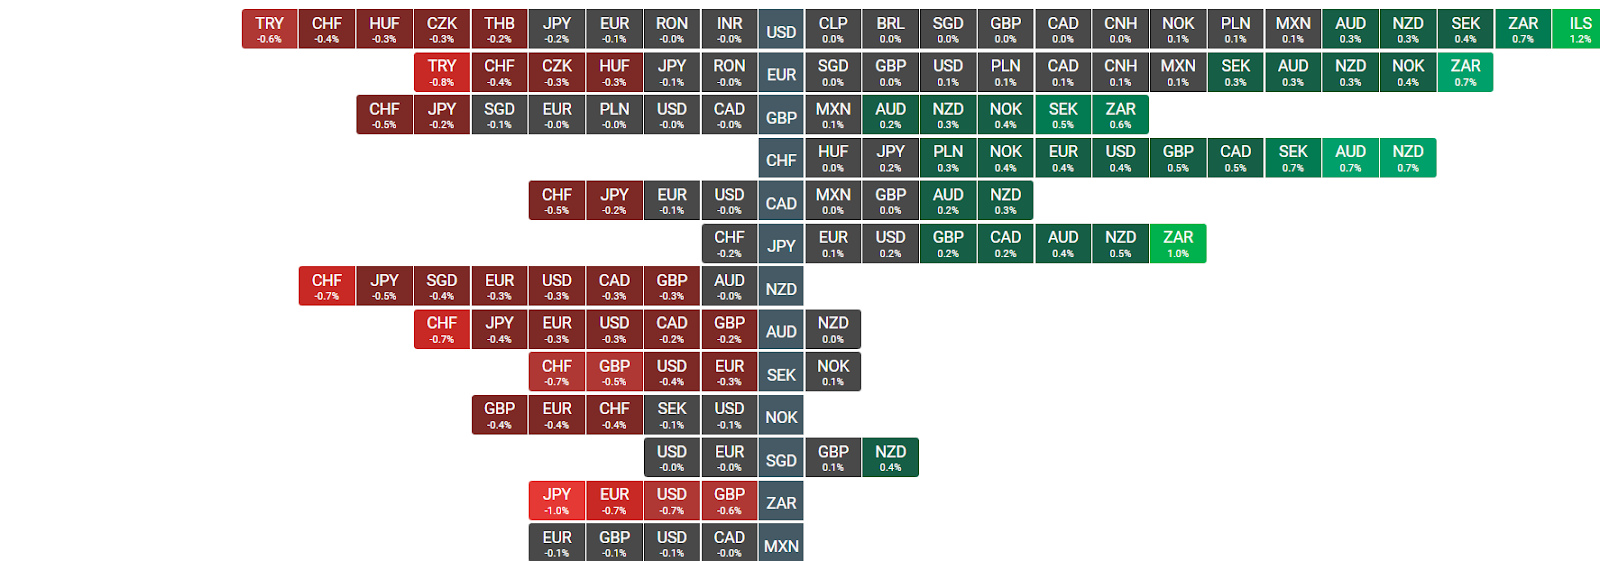
Forex Heatmap. Source: xStation 5
Henrique Tomé,Analyst Portugal

Politics batter the UK bond market once more, as Starmer remains under pressure

Takaichi’s party wins elections in Japan – a return of debt concerns? 💰✂️

Three markets to watch next week (09.02.2026)

Geopolitical Briefing (06.02.2026): Is Iran Still a Risk Factor?
This content has been created by XTB S.A. This service is provided by XTB S.A., with its registered office in Warsaw, at Prosta 67, 00-838 Warsaw, Poland, entered in the register of entrepreneurs of the National Court Register (Krajowy Rejestr Sądowy) conducted by District Court for the Capital City of Warsaw, XII Commercial Division of the National Court Register under KRS number 0000217580, REGON number 015803782 and Tax Identification Number (NIP) 527-24-43-955, with the fully paid up share capital in the amount of PLN 5.869.181,75. XTB S.A. conducts brokerage activities on the basis of the license granted by Polish Securities and Exchange Commission on 8th November 2005 No. DDM-M-4021-57-1/2005 and is supervised by Polish Supervision Authority.