- European indices end the session with solid gains
- US ISM Services beat market expectations
- Bitcoin price broke above $50,000
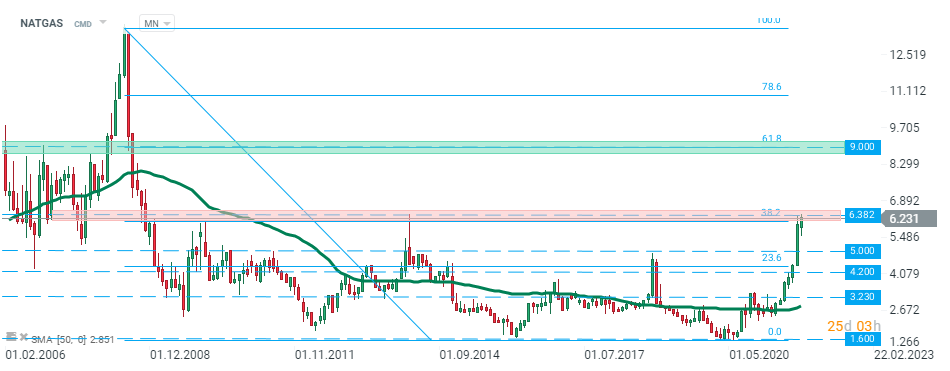
- NATGAS is testing the 2014 highs
European indices advanced more than 1% on Tuesday, rebounding from Monday’s selloff underpinned by gains across banks and tech shares. Positive moods are also visible in the United States. Immediately after the start of the US session, the local stock indices rose sharply. Also better than expected services IMS reading for September lifted market sentiment further and upward move accelerated. Currently, the Nasdaq is trading 1.6% higher, while the S&P 500 rose 1.5% and the Dow Jones gained 1.28%.
On Tuesday, good moods also persist in the cryptocurrency market. The main digital asset- Bitcoin broke above the major resistance at 50,000, which may lead to the continuation of the upward move. Ethereum managed to break above the $ 3,430 handle, while Ripple is trading above $ 1.06.
When it comes to the commodity market, investors' attention is still focused on the "energy" sector, mainly on gas and crude oil, where we observe a continuation of the upward trend. NATGAS price surges nearly 10% and reached the highest level since February 2014 boosted by demand for US liquified natural gas exports as global inventories remain at historically low levels ahead of the winter season. Russian Gazprom has booked around a third of the available gas transit capacity for October via the Yamal-Europe pipeline and no extra transit capacity via Ukraine, according to Interfax. In Asia prices are also at a record of $32 as China and other major LNG buyers compete for available cargoes to meet demand for the super-cooled fuel. Crude oil price is also moving higher, in the evening the price increases of “black gold” reach almost 2%.
 NATGAS price is currently testing 2014 highs at $6.38. This level coincides with 38.2% Fibonacci retracement of the downard wave launched in July 2008. Should a break higher occur then the next target for the buyer is located at $9.00 and is marked with the 61.8 Fibonacci retracement. The nearest support lies around $5.00 and is marked with previous price reactions. Source: xStation5

USDCAD pair broke below the neckline of the head and shoulders pattern. According to the classic assumptions of technical analysis, breaking below the 1.2600 level may indicate a change in market sentiment and the beginning of a downward trend. In the case of such a scenario, the nearest support lies around1.2500 level, where local lows from September are located. Source: xStation5

Daily Summary - Powerful NFP report could delay Fed rate cuts

BREAKING: Massive increase in US oil reserves!

US OPEN: Blowout Payrolls Signal Slower Path for Rate Cuts?

US jobs data surprises to the upside, and boosts stocks and pushes back Fed rate cut expectations
This content has been created by XTB S.A. This service is provided by XTB S.A., with its registered office in Warsaw, at Prosta 67, 00-838 Warsaw, Poland, entered in the register of entrepreneurs of the National Court Register (Krajowy Rejestr Sądowy) conducted by District Court for the Capital City of Warsaw, XII Commercial Division of the National Court Register under KRS number 0000217580, REGON number 015803782 and Tax Identification Number (NIP) 527-24-43-955, with the fully paid up share capital in the amount of PLN 5.869.181,75. XTB S.A. conducts brokerage activities on the basis of the license granted by Polish Securities and Exchange Commission on 8th November 2005 No. DDM-M-4021-57-1/2005 and is supervised by Polish Supervision Authority.


