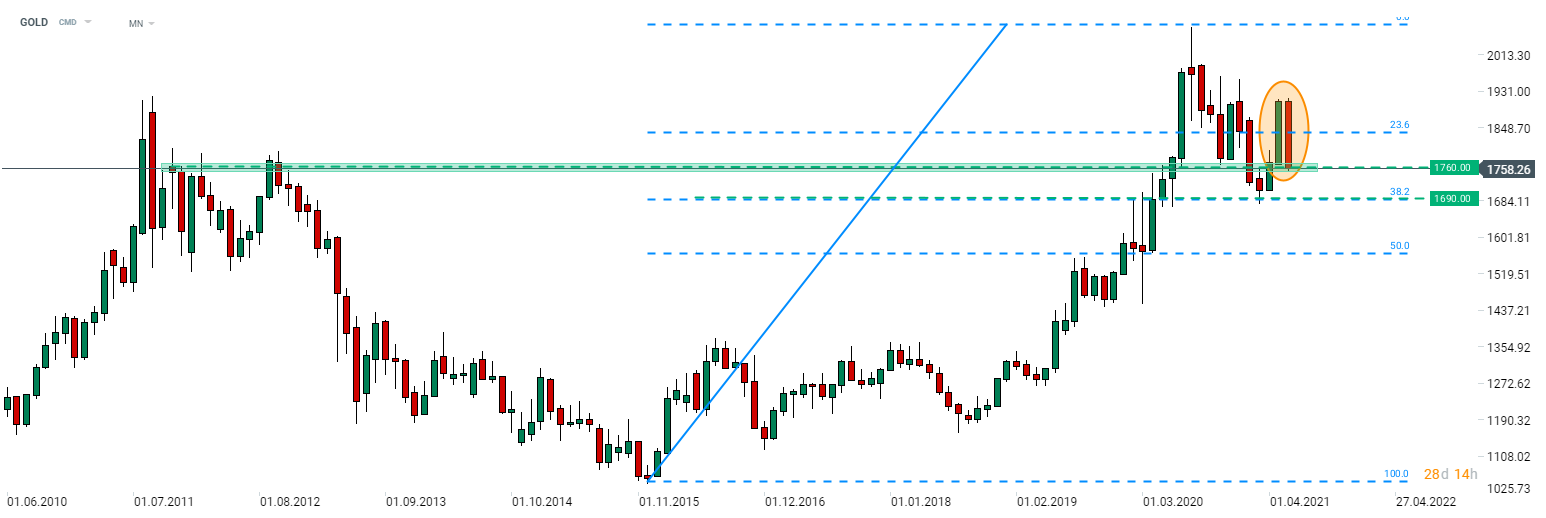
Gold price took a hit yesterday and dropped $15 per ounce. Unless a major recovery occurs today, gold may experience the largest monthly drop since November 2016. Drop in prices yesterday was accompanied by strengthening of the US dollar. Taking a look at GOLD at monthly time frame, we can see that a bearish engulfing pattern surfaced on the chart. In theory, this is a bearish signal but will not be confirmed until the current monthly candlestick closes.
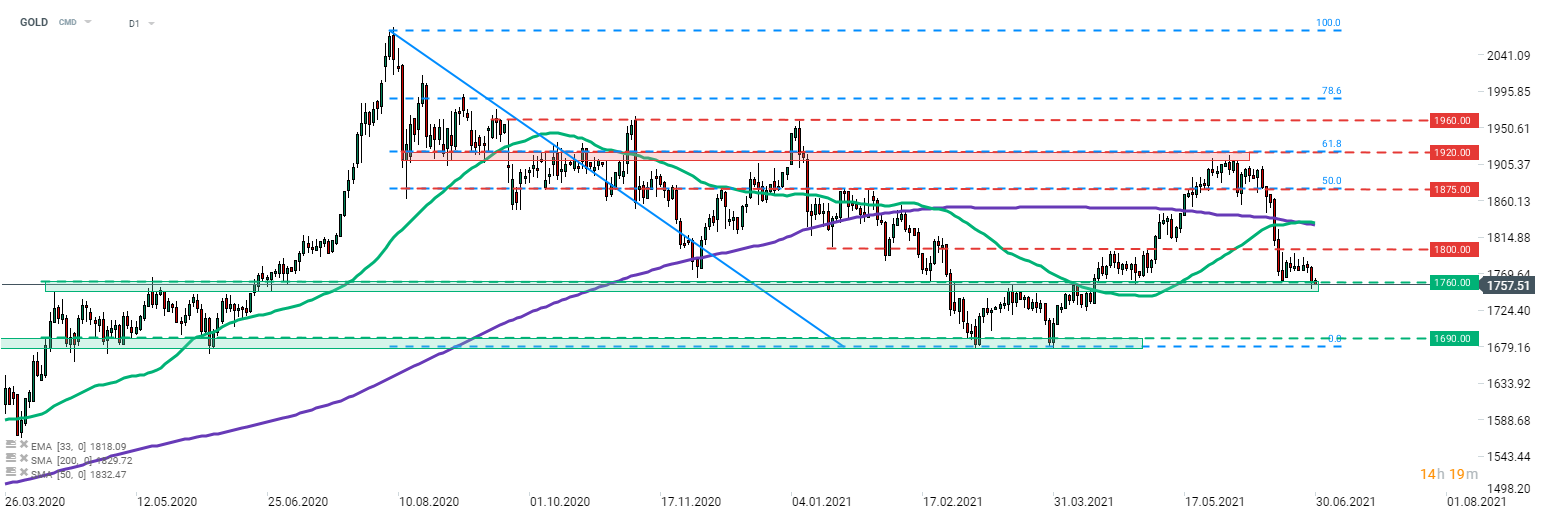
Taking a look at GOLD at lower, daily time frame, we can see that the price pulled back and is testing the support zone in the $1,760 area. Breaking below this hurdle would pave the way for a test of the next major support in the $1,690 area.
Today's ADP employment report release may have an impact on USD and therefore on gold as well. Traders should stay on guard near 1:15 pm BST.
 GOLD painted a bearish engulfing pattern at monthly time frame. Source: xStation5
 GOLD at daily time frame. Source: xStation5

Daily summary: Weak US data drags markets down, precious metals under pressure again!

NATGAS slides 6% on shifting weather forecasts

The Week Ahead

Three markets to watch next week (09.02.2026)
This content has been created by XTB S.A. This service is provided by XTB S.A., with its registered office in Warsaw, at Prosta 67, 00-838 Warsaw, Poland, entered in the register of entrepreneurs of the National Court Register (Krajowy Rejestr Sądowy) conducted by District Court for the Capital City of Warsaw, XII Commercial Division of the National Court Register under KRS number 0000217580, REGON number 015803782 and Tax Identification Number (NIP) 527-24-43-955, with the fully paid up share capital in the amount of PLN 5.869.181,75. XTB S.A. conducts brokerage activities on the basis of the license granted by Polish Securities and Exchange Commission on 8th November 2005 No. DDM-M-4021-57-1/2005 and is supervised by Polish Supervision Authority.


