US PCE Price Index YoY Actual 2.5% vs 2.5% expected vs 2.5% previously
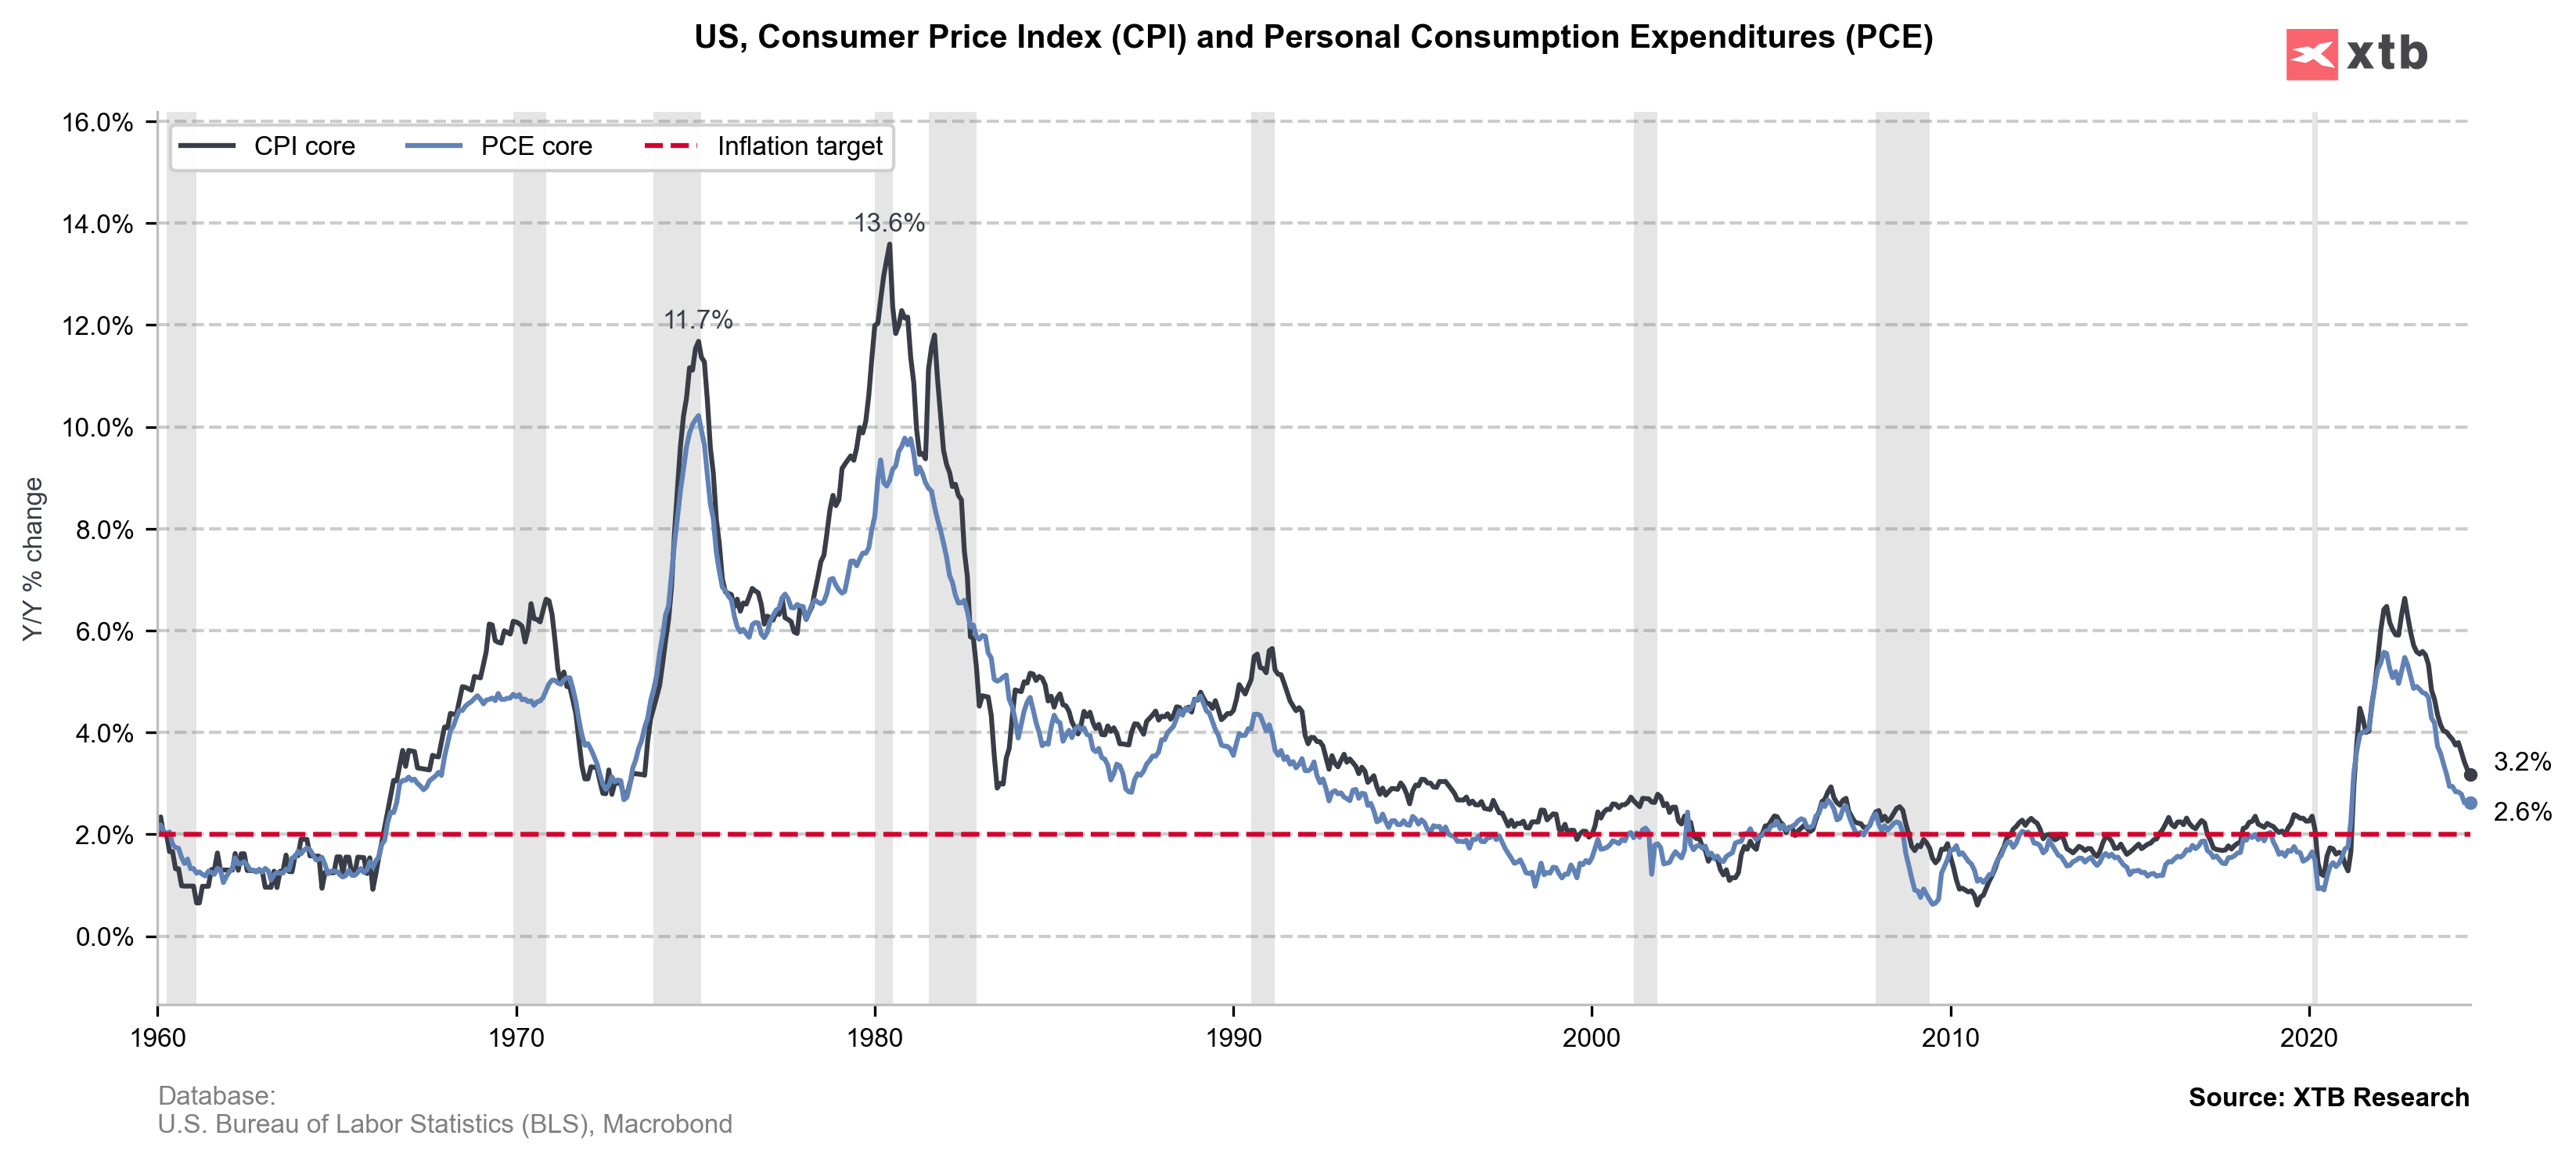
US Core PCE Price Index YoY: 2.6% vs 2.7% exp. vs 2.6% previously
- US Real Personal Consumption MoM came in 0.4% vs 0.3% exp. vs 0.2% previously
- US Consumer Spending MoM came in 0.5% in line with 0.5 exp. vs 0.3% previously
- US Personal Income came in 0.3% MoM vs 0.2% exp. vs 0.2% previously
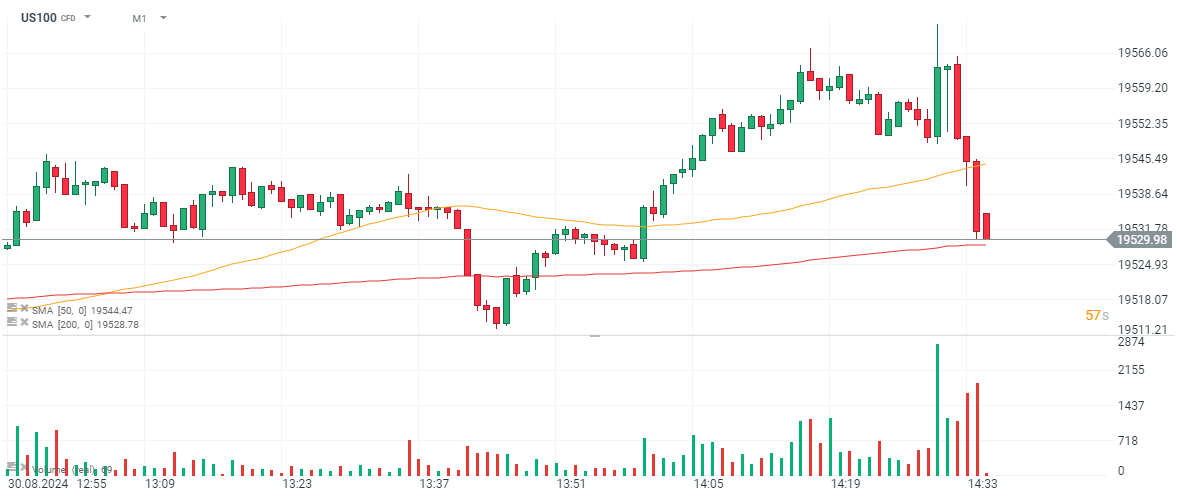
US July PCE price index ex-food/energy/housing came in at 0.1% MoM pace, with ex-energy/housing 0.2% higher on a monthly basis. Quite surprisingly, US100 loses in first reaction after US data, which are signalling further disinflation and solid income / consumer trend across the US economy. Short-term rate-futures on Federal Reserve interest rates, continue to price in a 25 bps Fed rate cut in Sept and 100 bps rate cuts in 2024.


BREAKING: US RETAIL SALES BELOW EXPECTATIONS

Economic calendar: Indices and EURUSD await US retail sales report

Morning wrap (10.02.2026)

Market wrap: Novo Nordisk jumps more than 7% 🚀
This content has been created by XTB S.A. This service is provided by XTB S.A., with its registered office in Warsaw, at Prosta 67, 00-838 Warsaw, Poland, entered in the register of entrepreneurs of the National Court Register (Krajowy Rejestr Sądowy) conducted by District Court for the Capital City of Warsaw, XII Commercial Division of the National Court Register under KRS number 0000217580, REGON number 015803782 and Tax Identification Number (NIP) 527-24-43-955, with the fully paid up share capital in the amount of PLN 5.869.181,75. XTB S.A. conducts brokerage activities on the basis of the license granted by Polish Securities and Exchange Commission on 8th November 2005 No. DDM-M-4021-57-1/2005 and is supervised by Polish Supervision Authority.


