The Bank of England’s latest Monetary Policy Report gave a much-needed positive boost to the UK’s economic outlook. Growth was revised higher, while inflation was revised lower. Although the BOE did not confirm that a rate cut would come in June, the Governor Andrew Bailey sounded more comfortable with the prospect of rate cuts in the near future. It is also worth noting that Bailey also did not rule out a rate cut next month, instead saying that it will depend on the economic data. There are two inflation points between now and the next BOE meeting in June, so there’s all to play for.
The market impact has mostly been felt in equities. The pound initially fell on Thursday, before rebounding, and GBP/USD is currently hovering around the $1.25 mark. Market-based interest rate expectations are also mostly unchanged. There is a 45% chance of a June rate cut, with the market still expecting the first cut to come in August, a Monetary Policy Report month. However, as mentioned, there could be more volatility on the back of the next UK CPI report which is released on 22nd May.
Stocks warmed to the BOE meeting the most, and the FTSE 100 and the FTSE 350 both reached fresh intra-day record highs on the back of this report. Stocks are fading slightly as we move towards the end of the European session, potentially because the BOE would not commit to a June cut. However, we think that this report could be positive for UK stocks in the long term. The GDP and inflation forecasts included in the report suggest that the disinflation trend in the UK can continue at nearly full employment, and the growth path is set to improve consistently over the next 3 years. CPI is expected to fall to the BOE’s target in 2026, a year earlier than what was anticipated in the February report. The BOE is painting a positive economic backdrop for the future of the UK, and that is good news for UK stocks.
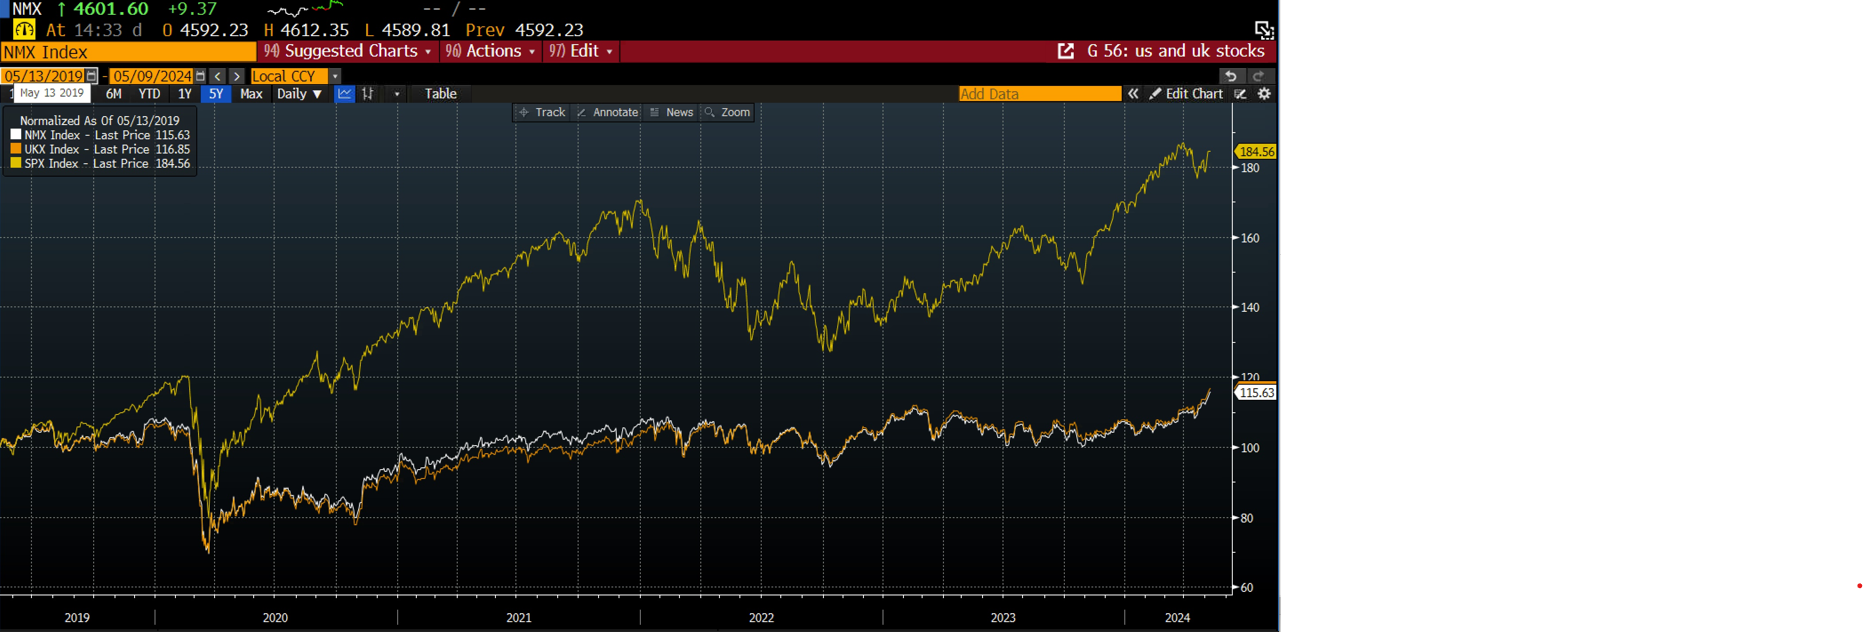
As you can see in the chart below, the FTSE 100 and the FTSE 350 (white line) track each other closely. There is also a large gap in performance between the UK indices and the S&P 500 in the US, the yellow line in the chart. This chart has been normalized to show how all three indices move together. While the UK indices have reached record highs recently, they still have a long way to go to catch up with the US blue chip index. For UK stocks to narrow the gap further, we may need to see more progress made on inflation and decent growth data to firm up the chances of a summer rate cut from the BOE.
Chart 1:

Source XTB and Bloomberg

Palo Alto acquires CyberArk. A new leader in cybersecurity!

US OPEN: Blowout Payrolls Signal Slower Path for Rate Cuts?

US jobs data surprises to the upside, and boosts stocks and pushes back Fed rate cut expectations

Join NFP Live Now
This content has been created by XTB S.A. This service is provided by XTB S.A., with its registered office in Warsaw, at Prosta 67, 00-838 Warsaw, Poland, entered in the register of entrepreneurs of the National Court Register (Krajowy Rejestr Sądowy) conducted by District Court for the Capital City of Warsaw, XII Commercial Division of the National Court Register under KRS number 0000217580, REGON number 015803782 and Tax Identification Number (NIP) 527-24-43-955, with the fully paid up share capital in the amount of PLN 5.869.181,75. XTB S.A. conducts brokerage activities on the basis of the license granted by Polish Securities and Exchange Commission on 8th November 2005 No. DDM-M-4021-57-1/2005 and is supervised by Polish Supervision Authority.


