Bitcoin is trading near $23,000 today. After Powell's speech yesterday, cryptocurrencies were unable to continue their rally despite the initial euphoria. The mood among cryptocurrencies is mixed, with the biggest loser being Graph which gained nearly 50% yesterday on the AI trend. Let's take a look at some key 'on-chain' indicators like NUPL and SOPR, and see how the balance of short (STH) and long-term (LTH) BTC addresses:
NUPL (Net Unrealized Profit/ Loss Ratio) indicator tracks the ratio of unrealized profit/loss and shows that the rally has lifted Bitcoin above the average purchase price of the broad market, making the 'average' BTC holder back in profit. Compiling the duration of the negative NUPL in all the bull markets, we observe a historical similarity between the current cycle (166 days) and the bear markets of 2011-12 (157 days) and 2018-19 (134 days). However, the 2015-2016 bear market stood out under this, experiencing a dominance of unrealized losses twice as long as the current one. This could serve as a potential warning signal should BTC return below $20,000. Source: Glassnode

The ratio between the total unrealized gain held by the market and its annual average could be another indicator of momentum. The momentum metric is currently approaching the equilibrium point and shows similarities to the recent phases of the 2015 and 2018 bull markets. Confirmed breakouts above the equilibrium point (1 - the horizontal red line) coincided with a change in the market's profit structure in the past foreshadowed a longer recovery in sentiment. The length of time elapsed below the equilibrium point was similar in all major bear markets, but reaching a key on-chain level may foreshadow supply resistance - the index is struggling to climb above resistance on a sustained basis, which underscores how important it is to overcome $24,000 on a sustained basis. Source: Glassnod
The SOPR (Spent Output Profit Ratio) indicator can be used to check the profit aggregated by different groups of BTC holders. For short-term traders (STH, in red), we see that the STH-SOPR is currently trading above the 1.0 value, showing the first sharp increase in profitability since March 2022. This reflects the large amount of BTC purchased at lower prices in recent months, which can be sold at a profit if sentiment weakens further. Source: Glassnode

It is positive that not only short-term investors but the broader market also gained after a very deep and prolonged period of losses. However, assessing the LTH (Long Term Holder) group of long-term investors, we can see that the stressful situation has continued nd since the LUNY implosion. Although the group is still, on average, in a loss, there are the first signs of recovery, including the potential formation of an upward LTH-SOPR trend. During the 2018 bull market, long-term investors averaged 291 days in losses; today it's about 265 days. Source: Glassnode
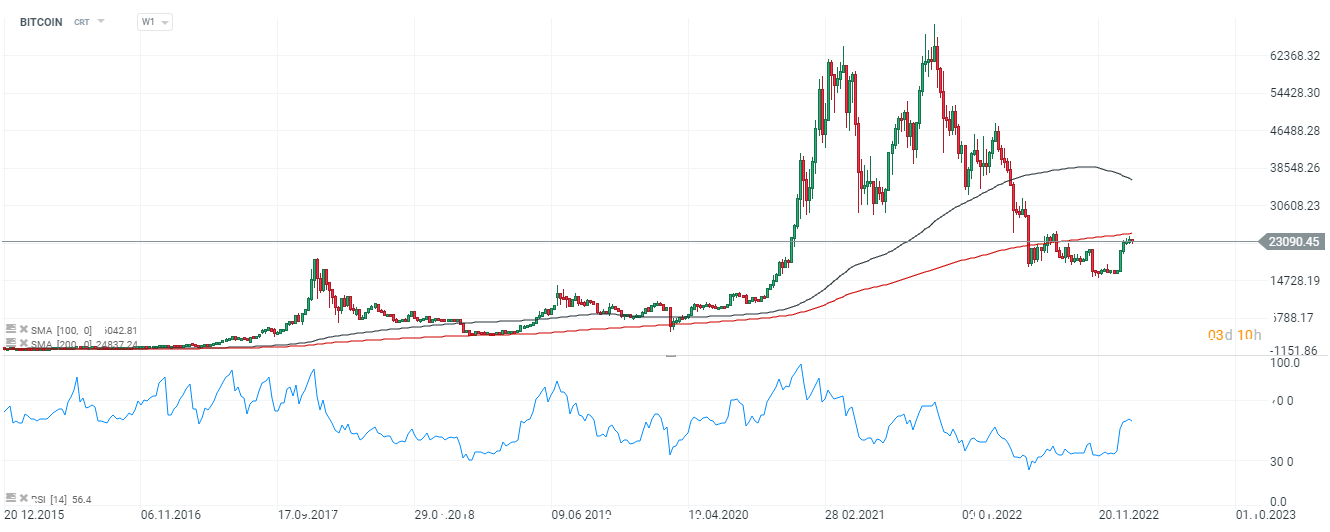
 Bitcoin, W1 interval. The major cryptocurrency is still struggling to climb above the 200-week average, which has turned into resistance from its historic, very strong support in 2022. Source: xStation5

Daily summary: Weak US data drags markets down, precious metals under pressure again!

🚨 Bitcoin drops to $69,000 📉 A 1:1 correction scenario?

Market wrap: Novo Nordisk jumps more than 7% 🚀

Crypto news: Bitcoin falls below $70k 📉Will crypto slide again?
This content has been created by XTB S.A. This service is provided by XTB S.A., with its registered office in Warsaw, at Prosta 67, 00-838 Warsaw, Poland, entered in the register of entrepreneurs of the National Court Register (Krajowy Rejestr Sądowy) conducted by District Court for the Capital City of Warsaw, XII Commercial Division of the National Court Register under KRS number 0000217580, REGON number 015803782 and Tax Identification Number (NIP) 527-24-43-955, with the fully paid up share capital in the amount of PLN 5.869.181,75. XTB S.A. conducts brokerage activities on the basis of the license granted by Polish Securities and Exchange Commission on 8th November 2005 No. DDM-M-4021-57-1/2005 and is supervised by Polish Supervision Authority.


