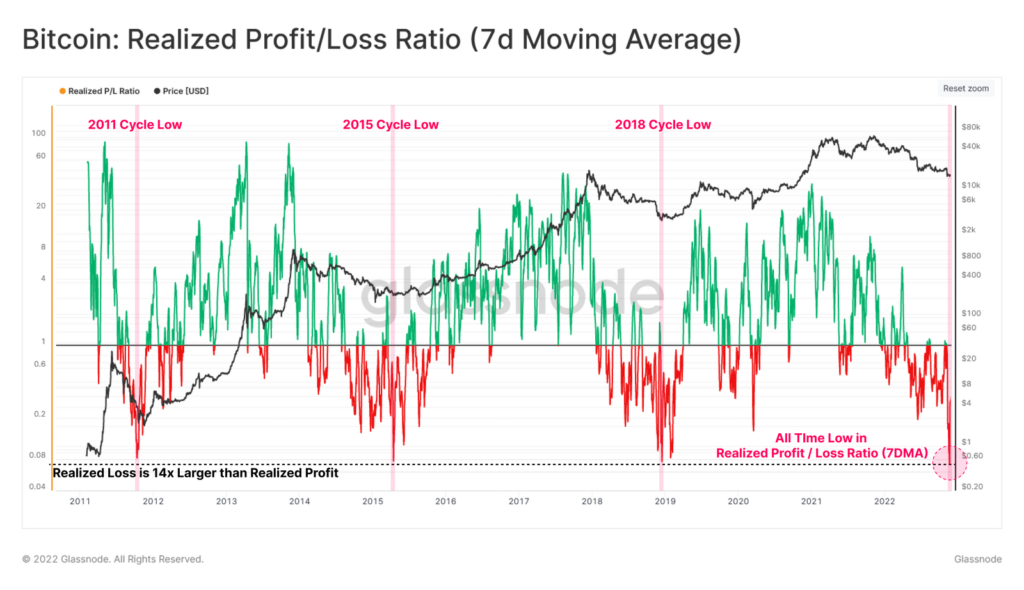
Bitcoin is trying to hold near $17,000 despite deteriorating sentiment on stock market indices. Analyst firm Glassnode reported that the major cryptocurrency has reached several important on-chain levels: The average of realized losses was at new historical peaks at 0.60, indicating a progressive, unprecedented sell-off in the cryptocurrency market. Historically, these levels have proven to be opportunities for accumulation and heralded an impending rally by cryptocurrency bulls. The level of losses realized by the market since 2011 has become 14 times the level of realized gains. We also see a preserved '4-year cyclicality' in relation to the previous 'cryptocurrency winters' of 2011, 2015 and 2018. Source: Glassnode
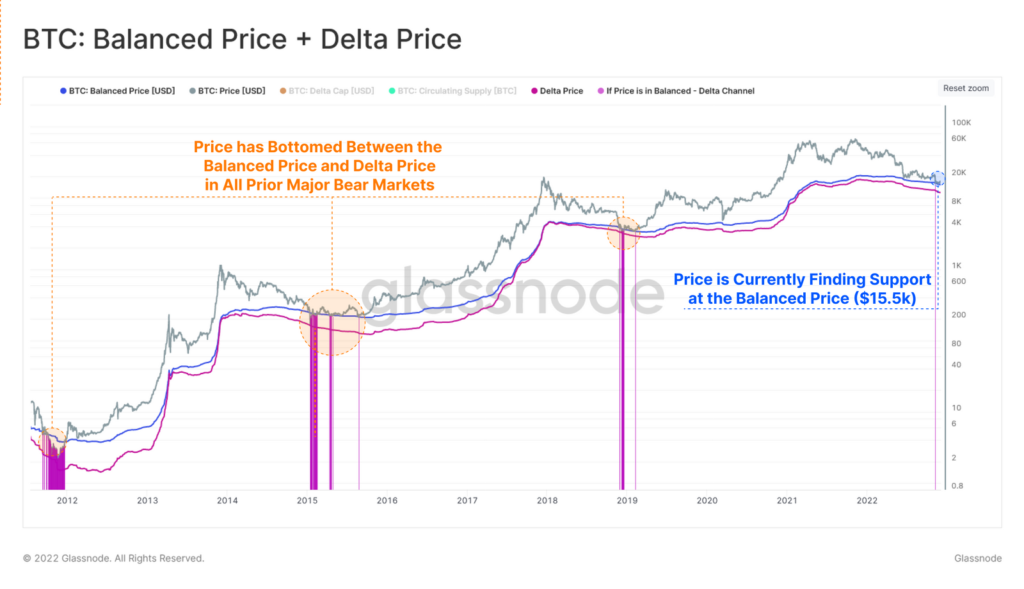
 The chart shows two on-chain metrics to better represent the network's cost basis, and which have been breached in previous bear markets. Balanced price (Balanced price, blue band) is an experimental attempt to capture the 'fair' valuation of Bitcoin by measuring the difference between the value investors paid for it and the value of liquidated Bitcoins (Transferred price). The delta price (Delta price, purple band) is the difference between Bitcoin's realized capital and capitalization divided by circulating supply; the moving average refers to Bitcoin's total lifetime. In none of the previous besses did the price of Bitcoin fall below the 'Delta Price' (purple). Only for about 136 of the last 4518 BTC days was there a period where we could see the price 'touching' the balanced price. Currently, we see that both lines are between $15,500 and $12,000. Bitcoin's price briefly found itself near the balanced price after the collapse of FTX, but the bulls quickly reacted by taking the stock up. Throughout BTC's history, the balanced price has proven to be the ultimate support level for Bitcoin, below which declines have never occurred.Source: Glassnode
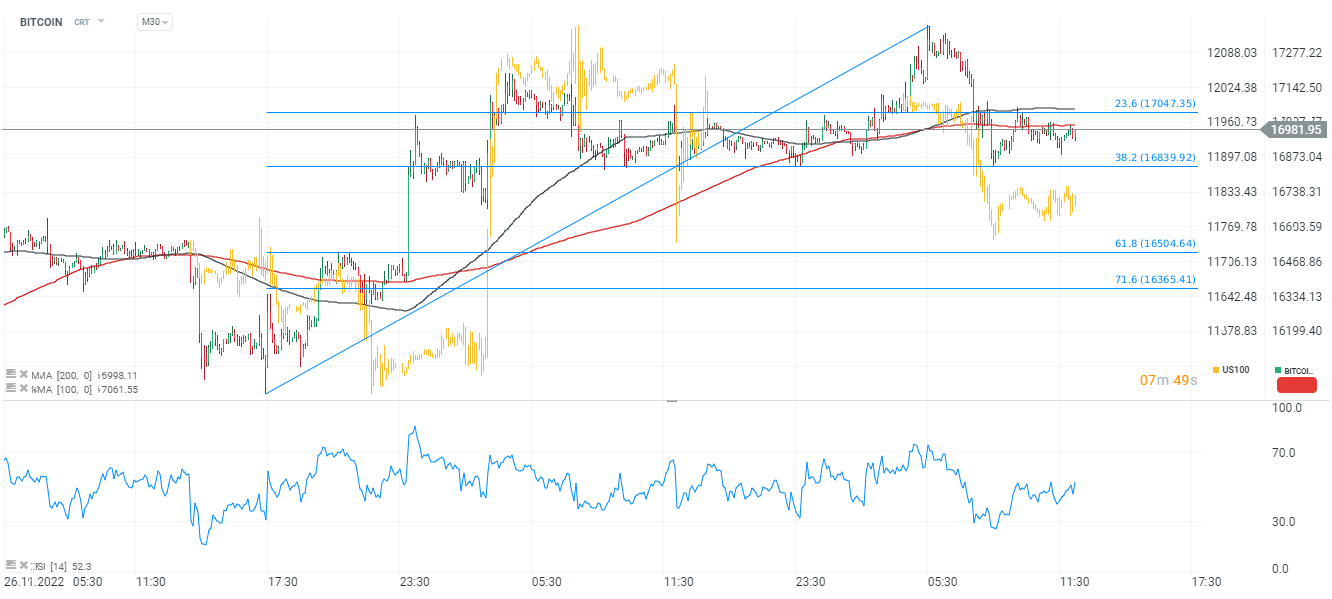
 Bitcoin chart, M30 interval. The major cryptocurrency managed to hold the $17,000 level despite yesterday's dynamic sell-off, during which supply quickly pushed the bulls on the defensive and prevented it from reaching the $17,500 level. We also see that bitcoin continues to correlate with the NASDAQ index (yellow chart). Yesterday's declines on the indexes translated into sentiment in the cryptocurrency industry. As a result, Bitcoin has again slipped below the 200-session average (red line), and the next closest support is the levels at $16,800, where the 38.2 Fibonacci abolition of the upward wave that began in late November is located. Source: xStation5

Market wrap: Novo Nordisk jumps more than 7% 🚀

Crypto news: Bitcoin falls below $70k 📉Will crypto slide again?

Morning wrap: Tech sector sell-off (06.02.2026)

Technical analysis: Bitcoin deepens decline falling to $66.5k 📉
This content has been created by XTB S.A. This service is provided by XTB S.A., with its registered office in Warsaw, at Prosta 67, 00-838 Warsaw, Poland, entered in the register of entrepreneurs of the National Court Register (Krajowy Rejestr Sądowy) conducted by District Court for the Capital City of Warsaw, XII Commercial Division of the National Court Register under KRS number 0000217580, REGON number 015803782 and Tax Identification Number (NIP) 527-24-43-955, with the fully paid up share capital in the amount of PLN 5.869.181,75. XTB S.A. conducts brokerage activities on the basis of the license granted by Polish Securities and Exchange Commission on 8th November 2005 No. DDM-M-4021-57-1/2005 and is supervised by Polish Supervision Authority.


