With Heikin-Ashi candles, we can identify the beginning of movements with greater reliability. Let's see how we can take advantage of it for our operations.
The Heikin-Ashi candle technique should be a complement to the analyses with other existing means.
In Heikin-Ashi, there are no patterns that we have to learn as we do with the Japanese Candle technique, and therefore we only have to follow the three types of candles that Heikin-Ashi uses.
- Large white body with upper shadow (in uptrends).
- Large black body with lower shadow (in downtrends).
- Candles are similar to a doji (in moments of indecision or near change of trend).
Here, the existing trends are better appreciated, and in the initial moments of possible trend changes, doji-like candles appear.
It must also be said that with this system there are no gaps between successive candles due to the formula used in the creation of Heikin-Ashi candles.
What the ha7 indicator shows is a reinforcement of the application of the Heikin-Ashi technique, confirming or denying buy and / or sell signals depending on the type of crossover made by the indicator and a 7-session moving average.
Rules in Heikin-Ashi
- White body sequence = uptrend. Black body sequence = downtrend.
- Strong bullish trend = Large white bodies and no lower shadows. Strong bearish trend = Large black bodies with no upper shadows.
- When the trend weakens, small bodies appear with possible upper and / or lower shadows.
- A consolidation occurs when small bodies appear with both shadows, both above and below.
- The reversal of a trend can be suspected with the appearance of small bodies with long shadows both above and below, or a sudden change in colour.
Heikin-Ashi Sail Construction
- haClose = (O + H + L + C) / 4
- haOpen = (previous haOpen + previous haClose) / 2
- haHigh = Max (H, haOpen, haClose)
- haLow = Min (L, haOpen, haClose)
Heikin-Ashi Quantification
Technical analyst Dan Valcu, introducer of Heikin-Ashi candles in the West, in his article published in 2004 in the magazine ‘Stocks & Commodities V. 22: 2 (16-17,20-22,24-26,28): Using The Heikin-Ashi Technique by Dan Valcu’ quantifies Heikin-Ashi with an Indicator called haDelta, which is simply the difference between haOpen and haClose, adding a moving average of three sessions to it.
We have investigated the ProRealTime Platform and we have created a variant of haDelta, which we have called ha7, and which differs from haDelta by not seeing so many false signals of crossover between the Indicator and its moving average. So in the examples in this article, we will use ha7.
We do the quantification of the Heikin-Ashi candles with the ha7 Indicator using the ProRealTime platform:
The ha7 code for this platform is as follows:
IF Data = BarIndex- (BarIndex-1) THEN
x = (Open + (Open + High + Low + Close) / 4)
y = (Open + High + Low + Close) / 4
ELSIF Data = (BarIndex-BarIndex <2) THEN
x = Dopen (1) + (Open + High + Low + Close) / 4
y = (Open + High + Low + Close) / 4
ENDIF
z = Average [7] (xy)
RETURN xy, z COLORED (0, 0.255)
How Heikin-Ashi Candles Are Interpreted Using the Five Basic Rules
We have represented 13 spaces named from C0 to C12 to apply the five basic rules of the Heikin-Ashi candles:
C0: Here we apply rule 4. A consolidation occurs when small bodies appear with both shadows, both above and below.
C1: Here we reflect what was said in rule 2. Strong bearish trend = Large black bodies without upper shadows.
C2: Here we can observe rule 5. A trend reversal can be suspected with the appearance of small bodies with long upper and lower shadows.
C3: Here we act according to rule 2. Strong bullish trend = Large white bodies and no lower shadows.
C4: Here we can apply rule 5. The reversal of a trend can be suspected with the appearance of small bodies with long upper and lower shadows.
C5: Here we mention rule 2. Strong bearish trend = Large black bodies with no upper shadows.
C6: Rule 4 applies here. A consolidation occurs when small bodies appear with both shadows above and below.
C7: Here we can apply rule 1. Sequence of black bodies = downtrend.
C8: We can apply two rules here.
First, rule 5. A trend reversal can be suspected when a sudden change in colour occurs.
Second, rule 2. Strong bullish trend = Large white bodies and no lower shadows.
C9: Here we can apply rule 3. When the trend weakens, small bodies appear with possible upper and / or lower shadows.
C10: Here we apply rule 2. Strong bearish trend = Large black bodies with no upper shadows.
C11: Here we apply rule 3. When the trend weakens, small bodies appear with possible upper and / or lower shadows.
C12: Here we apply rule 1. Sequence of white bodies = uptrend.
Let's see two examples of analysis and trading with
Technical Analysis with Heikin-Ashi from Caixabank
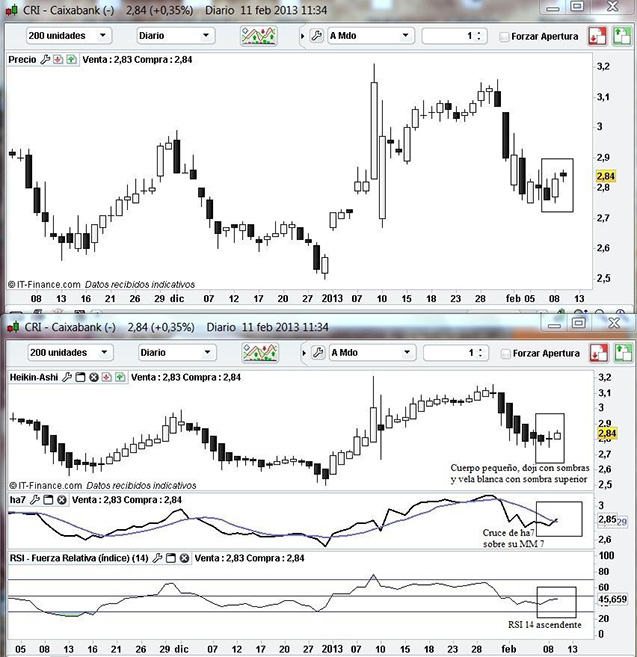
Just as in the Japanese candle chart, here we do not see a clear sign of a trend change. In the Heikin-Ashi candle chart, we can see that after a previous downtrend, a small black body appears followed by a doji with shadows, both upper and lower, and finally we see a white candle with an upper shadow indicating that an uptrend seems to be starting.
Applying some of the five Heikin-Ashi rules, we can see that after these three types of candles the beginning of an uptrend should appear.
Similarly, there is a cross of the ha7 indicator over its 7-session moving average in an upward direction, which increases the strength of the beginning of an upward trend.
The RSI indicator (14) is shown in an ascending direction, corroborating the incipient beginning of a possible uptrend, although in that case it would cross the line of 50 upwards and continue to rise.
In this way, if after this white candle with upper shadow, a similar candle followed, we would enter the value by making a purchase and going long.
 Source: XTB
Please be aware that the presented data refers to the past performance data and as such is not a reliable indicator of future performance.
Technical Analysis with Heikin-Ashi of Corporación Mapfre
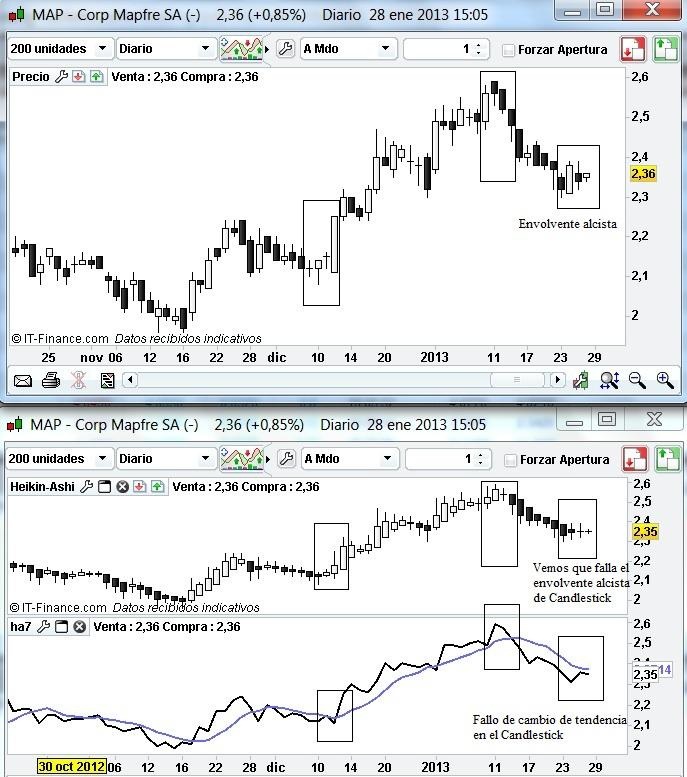
In recent days on the Japanese Candlestick chart, after a downtrend, what could be a bullish envelope appears, indicating a change in the upward trend. However, in the Heikin-Ashi chart, we see that a small body appears, as well as dojis that indicate that this possible uptrend that should have started is delayed (or does not exist), giving rise to a consolidation period, since for it to be a signal of possible change in trend should at least appear those final dojis with long upper and lower shadows.

Source: XTB
Please be aware that the presented data refers to the past performance data and as such is not a reliable indicator of future performance.
Similarly, the ha7 indicator does not have an upward crossover on the 7-session moving average, corroborating that there is no change in trend that made us suspect the possible bullish envelope with Candlestick.
This content has been created by XTB S.A. This service is provided by XTB S.A., with its registered office in Warsaw, at Prosta 67, 00-838 Warsaw, Poland, entered in the register of entrepreneurs of the National Court Register (Krajowy Rejestr Sądowy) conducted by District Court for the Capital City of Warsaw, XII Commercial Division of the National Court Register under KRS number 0000217580, REGON number 015803782 and Tax Identification Number (NIP) 527-24-43-955, with the fully paid up share capital in the amount of PLN 5.869.181,75. XTB S.A. conducts brokerage activities on the basis of the license granted by Polish Securities and Exchange Commission on 8th November 2005 No. DDM-M-4021-57-1/2005 and is supervised by Polish Supervision Authority.


