- Results for 4Q23/24
- Disappointing forecasts for 2025
- Lack of innovation
- Valuation overview
- Chart analysis
Nike's results for 4Q23/24 were significantly disappointing and surprising. In response to the company's report, shares of the sportswear manufacturer fell by 20%. While the results themselves were not overly disappointing, the company's outlook for the upcoming year and the announcement of a potential sales decline in 2025 created negative sentiment among investors, pushing the stock below $75. Since the beginning of this year, Nike's market valuation has already declined by over 30%.
Results for 4Q23/24
Sales in the fourth quarter of the fiscal year 23/24 amounted to $12.6 billion (-2% y/y). The company recorded a revenue decline in its footwear segment, which is Nike's most important sales segment. Revenues in this segment fell by 4% year-on-year. The largest decline was seen in North American sales. These results are disappointing compared to the performance of Nike's competitors. Adidas saw a 7% y/y increase in its footwear segment, while Puma reported a 3.1% increase. While Adidas has been showing continuous improvement in this segment since the second quarter and Puma has recovered from a strong downward trend since 4Q22, Nike has been experiencing a decline in this segment for seven quarters (except for a slight rebound in 3Q23/24). These signals indicate that despite its dominant position, Nike has not demonstrated sufficient innovation in its product offerings in recent quarters to address the issue of declining sales dynamics. Ultimately, this led to declines in the key segment.
إبدأ بالإستثمار اليوم أو تدرّب على حساب تجريبي
قم بفتح حساب حقيقي جرب الحساب التجريبي تحميل تطبيق الجوال تحميل تطبيق الجوالAt the EPS level, Nike reported $1.01 in the fourth quarter (non-GAAP), which is $0.17 more than the market consensus.

At the gross profit margin level, Nike showed a positive signal with an improvement of 1.1 percentage points to 44.7%. However, for 4Q23/24, this was mainly due to lower freight and logistics costs rather than an actual improvement in sales. Compared to its European competitors, Nike shows more resilient margin levels to potential fluctuations. While the company has lower gross profit margins compared to its competitors, it still maintains a slight advantage at the operating margin level.
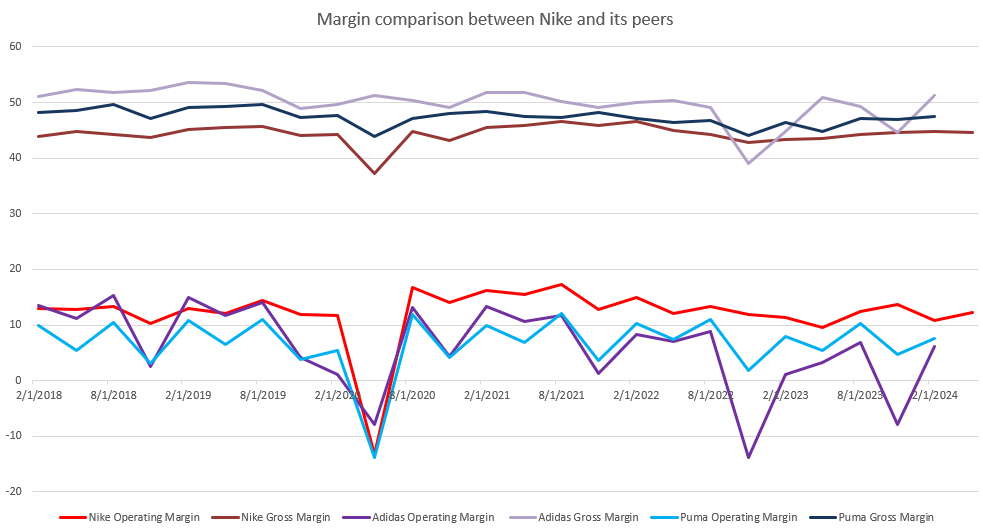
Comparison of Operating and Gross Profit Margins between Nike, Adidas, and Puma. Source: XTB Research, Bloomberg Finance L.P.
Disappointing Forecasts for 2025
The fourth quarter of fiscal year 2023/24 previewed the challenges the company currently faces. Consequently, the management decided to lower its forecasts for 2025. They now anticipate a sales decline of 4-6%, an increase from the earlier forecast of a 1-3% decline. The company expects an even steeper decline in the first half of the year, predicting a drop of over 5%, with a 10% decline in the first quarter alone. Additionally, the company does not expect any extraordinary gains from tax adjustments.
Largest Daily Price Drop in the Last Four Years
The results and disappointing forecasts for the next year pushed Nike's stock to its lowest levels since the pandemic-induced drop. The 20% decline was the largest single-session negative price movement in over five years. Following this sharp decline, the company is currently consolidating around $75.2 per share.
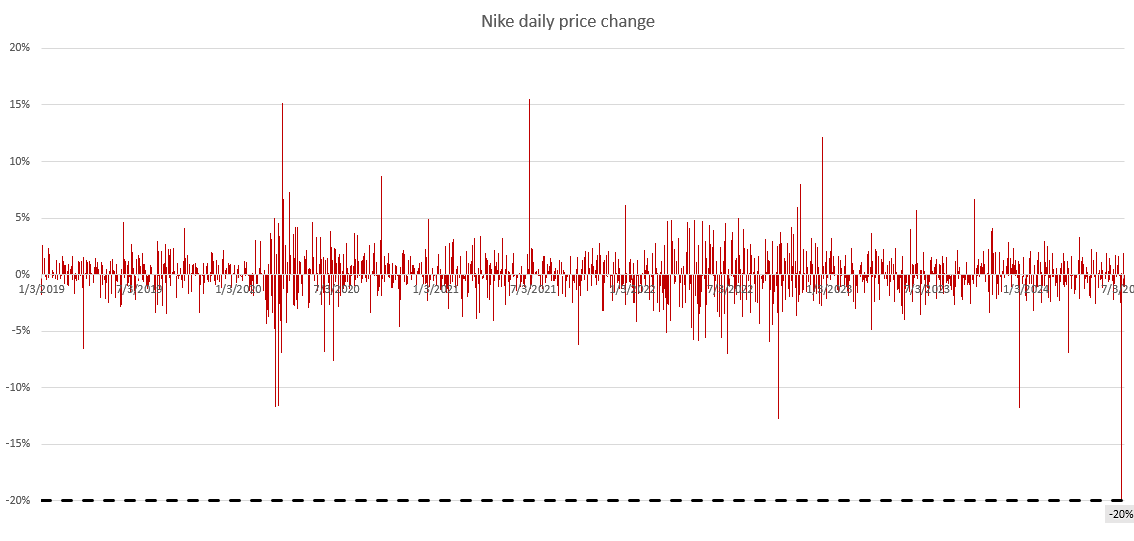
Daily Price Fluctuations of Nike. Source: XTB Research, Bloomberg Finance L.P.
Ongoing Share Buyback Program
The low valuations in recent years also have a positive aspect for investors. Since 2022, Nike has been running a share buyback program, aiming to allocate $18 billion for this purpose. In May 2024, Nike repurchased approximately $9.1 billion worth of its own shares. Year-over-year, the number of shares decreased from 1.556 billion to 1.516 billion. Given the recent significant market decline, it is likely that the company will be even more inclined to continue the program, providing additional funds to investors and allowing the company to buy back even more shares.
Declines Amid Potential Catalysts
The year 2024 is a celebration for sports fans, with the European Championships and Copa America, the two most important football tournaments after the World Cup, taking place. Additionally, the Olympic Games in Paris will start at the end of July. Such major events attract both new and loyal sports fans back to their beloved disciplines. The increased popularity of sports apparel could also act as a positive catalyst for sports equipment manufacturers' stock prices. However, Nike is clearly not benefiting from this sentiment. Broadly speaking, the company has not only "missed" the moment related to these major events, but its results do not reflect the general trends in global sports. An example is running segment, which gained popularity during the pandemic, and many "pandemic runners" remain interested in the sport today. Nike is losing ground to other companies that are dynamically developing this segment, such as Hoka, New Balance, and Asics. Although the running accessories segment is not the company's main revenue source, missing such opportunities and abandoning innovation might be at the root of the company's declining sales dynamics. By trying to diversify into many different sales channels, Nike may face stronger competition in each individual segment due to competitors' specialization, which could ultimately lead to further erosion of results.
Valuation Overview
At first glance, Nike's recent declines seem like a great opportunity to buy shares at the lowest prices in the past four years. However, let's examine whether the market valuation truly presents such a great opportunity.
We will evaluate the company's valuation using two popular methods: the discounted cash flow (DCF) method and the multiples method. We want to emphasize that these valuations are presented for informational purposes only and should not be considered as a recommendation or target price.
DCF Method
It's important to note that the DCF method relies on a series of assumptions, each of which can significantly impact the valuation outcome. For Nike, we decided to make a detailed forecast for a 5-year period. Our assumptions are based on average values from the past five years. We assumed a revenue growth rate of 7.3% and an operating margin stabilization at 12.4% for the forecast period. For the terminal value, we assumed a revenue growth rate of 3%. We adopted a weighted average cost of capital (WACC) of 9.4%.
With these assumptions, the resulting valuation yields a share price of $55.18, which is 27% below the current market value.
Since changes in individual parameters have a significant impact on the final valuation outcome, we present below matrices showing the change in value depending on: changes in the terminal revenue growth rate and the weighted average cost of capital (Matrix 1) and changes in the assumed operating margin and revenue growth rate during the forecast period (Matrix 2).
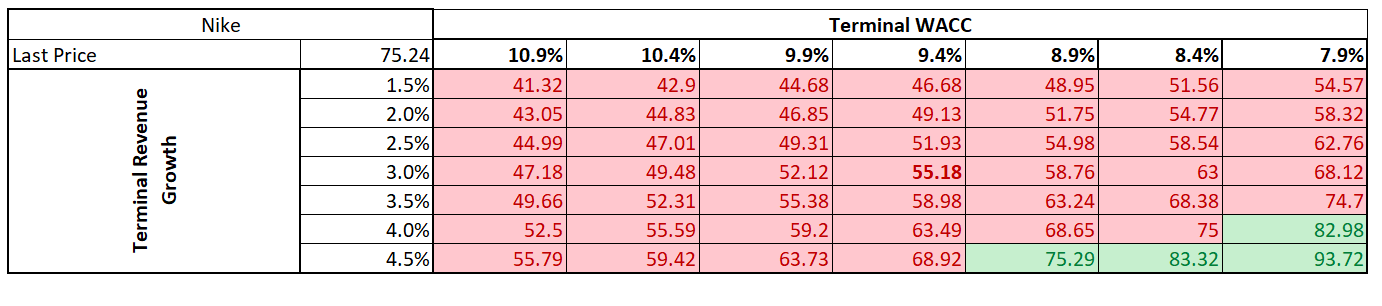
Valuation dependence on the change in WACC and revenue growth over the residual period. Source: XTB Research
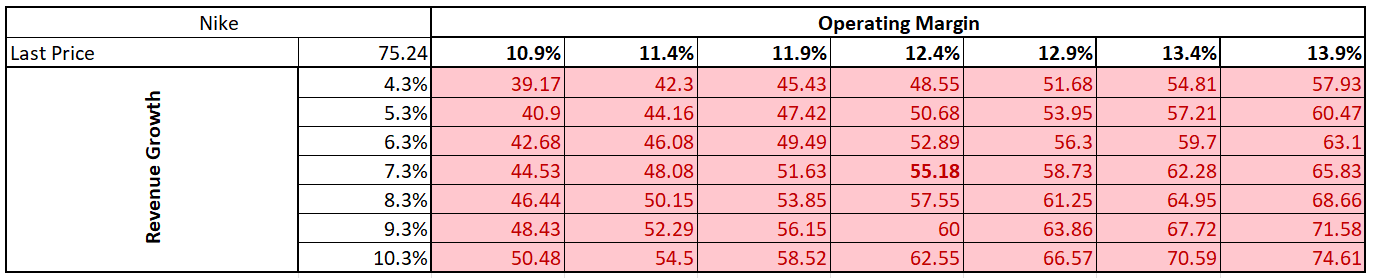
Valuation dependence on the change in operating margin and revenue growth over the detailed valuation period. Source: XTB Research
Multipliers
Valuation using multipliers compares the value of the company being valued against other companies operating in a similar industry. The limitation of this valuation method is, in particular, the selection of companies and their difference in size and nature of operations in relation to the company being valued. In the case of Nike, we opted for a comparison group consisting of the companies: Adidas, Puma, Under Armour, Colombia Sportswear, V.F. Corporation and Dick's Sporting Goods. The valuation ratios adopted are: P/E, Forward P/E, P/BV, P/S, Forward P/S, P/FCF, EV/S, Forward EV/S and EV/EBITDA.
Due to the large spreads between the ratios, we decided to choose a valuation using the median value of the ratios. As a result of the valuation, the estimated value of one Nike share price compared to its competitors is $50.6. However, it is worth bearing in mind that Nike differs significantly primarily in terms of size and market share relative to the compared companies.
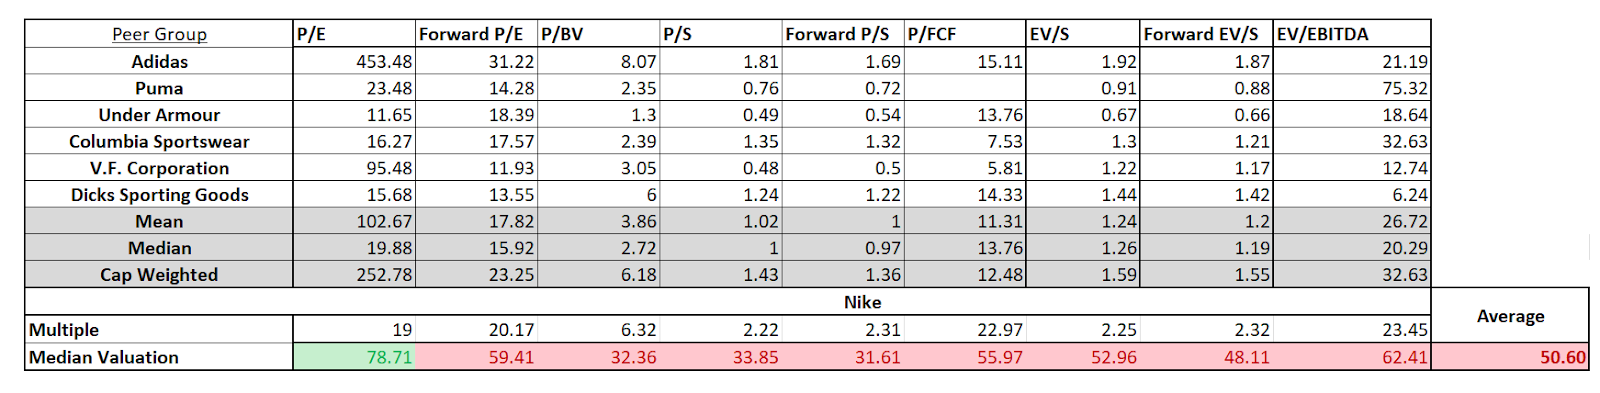
Comparative Valuation of Nike and Peer Group. Source: XTB Research, Bloomberg Finance L.P.
Chart Analysis
The post-earnings decline pushed Nike's stock significantly below key support levels, both in the two-year horizon and in a longer perspective. The stock broke through the $88.58 level set by the September 2023 lows and the March 2024 local lows, the $82.35 level set by the 2022 lows, and is now reinforcing the breach of the support marked by the 2020 price gap at $76.73. Sentiment suggests a potential approach to $72.46, the low from the first wave of the pandemic. Similar price gaps (though not of this magnitude) were previously noted in December last year and March this year, and the price has yet to close them. Furthermore, the decline caused the break of the lower boundary of the downtrend, thereby reinforcing potential bearish sentiments.

Source: xStation 5