
A broad technology sector selloff is weighing heavily on U.S. markets today, with industry leaders like Broadcom (AVGO.US) (-3.31%), Microsoft (MSFT.US) (-1.68%), and Salesforce (CRM.US) (-1.74%) leading the decline. The downturn is particularly notable in the semiconductor space, where companies like Micron Technology (MU.US) (-4.37%) and AMD (AMD.US) (-1.83%) are experiencing significant losses.
Market Breadth Concerns Mount
The selloff highlights growing concerns about market breadth, with less than 60% of S&P 500 companies now trading above their 200-day moving averages - the weakest level this year. This technical deterioration suggests the market's recent gains have been increasingly concentrated in a handful of large-cap tech names, raising vulnerability to sharp corrections.
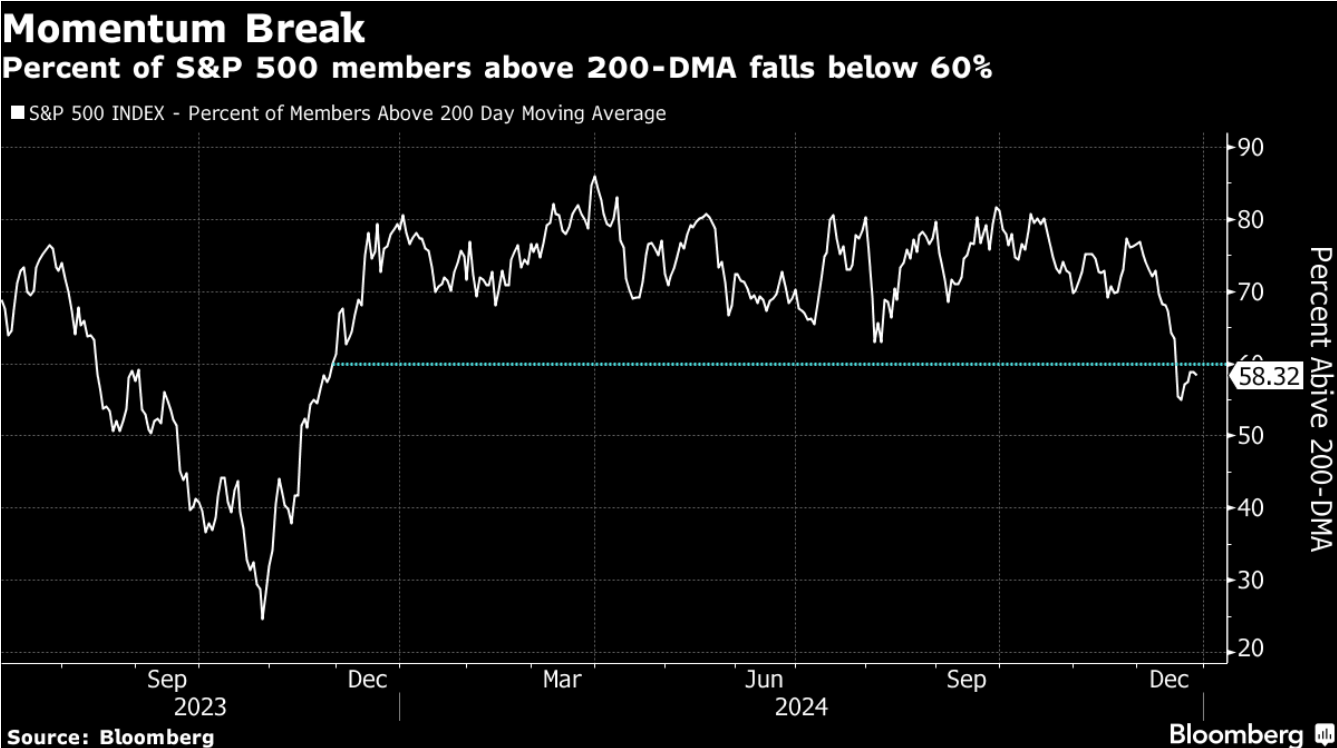
% of S&P 500 companies trading above their 200-day moving averages. Source: Bloomberg
Magnificent Seven Momentum Falters
Despite their stellar performance throughout 2024, even the Magnificent Seven stocks are showing signs of weakness. Apple has retreated -1.68% today, moving further away from its recent push toward the historic $4 trillion market cap milestone. NVIDIA, typically a market leader, is down -0.31%, while Meta (formerly Facebook) has declined more than -2%.
Sector-Wide Impact:
The technology sector weakness is broad-based:
-
Enterprise software companies like Oracle (-2.41%) and Dell (-3.62%) are seeing substantial declines
-
Cybersecurity firms including CrowdStrike (-2.53%) and Fortinet (-1.96%) are under pressure
-
Semiconductor equipment makers such as Applied Materials (-2.70%) and Lam Research (-2.60%) are experiencing notable losses
Looking Ahead:
Market participants appear to be booking profits in 2024's winners as the year draws to a close. With expectations for slower earnings growth among the Magnificent Seven in 2025, investors may be repositioning for a broader market leadership transition in the coming year.
The current selloff has effectively erased most of December's gains, challenging hopes for a traditional Santa Claus rally in the final trading days of 2023. However, historical patterns suggest the potential for a recovery in January, particularly once holiday-related liquidity constraints ease.
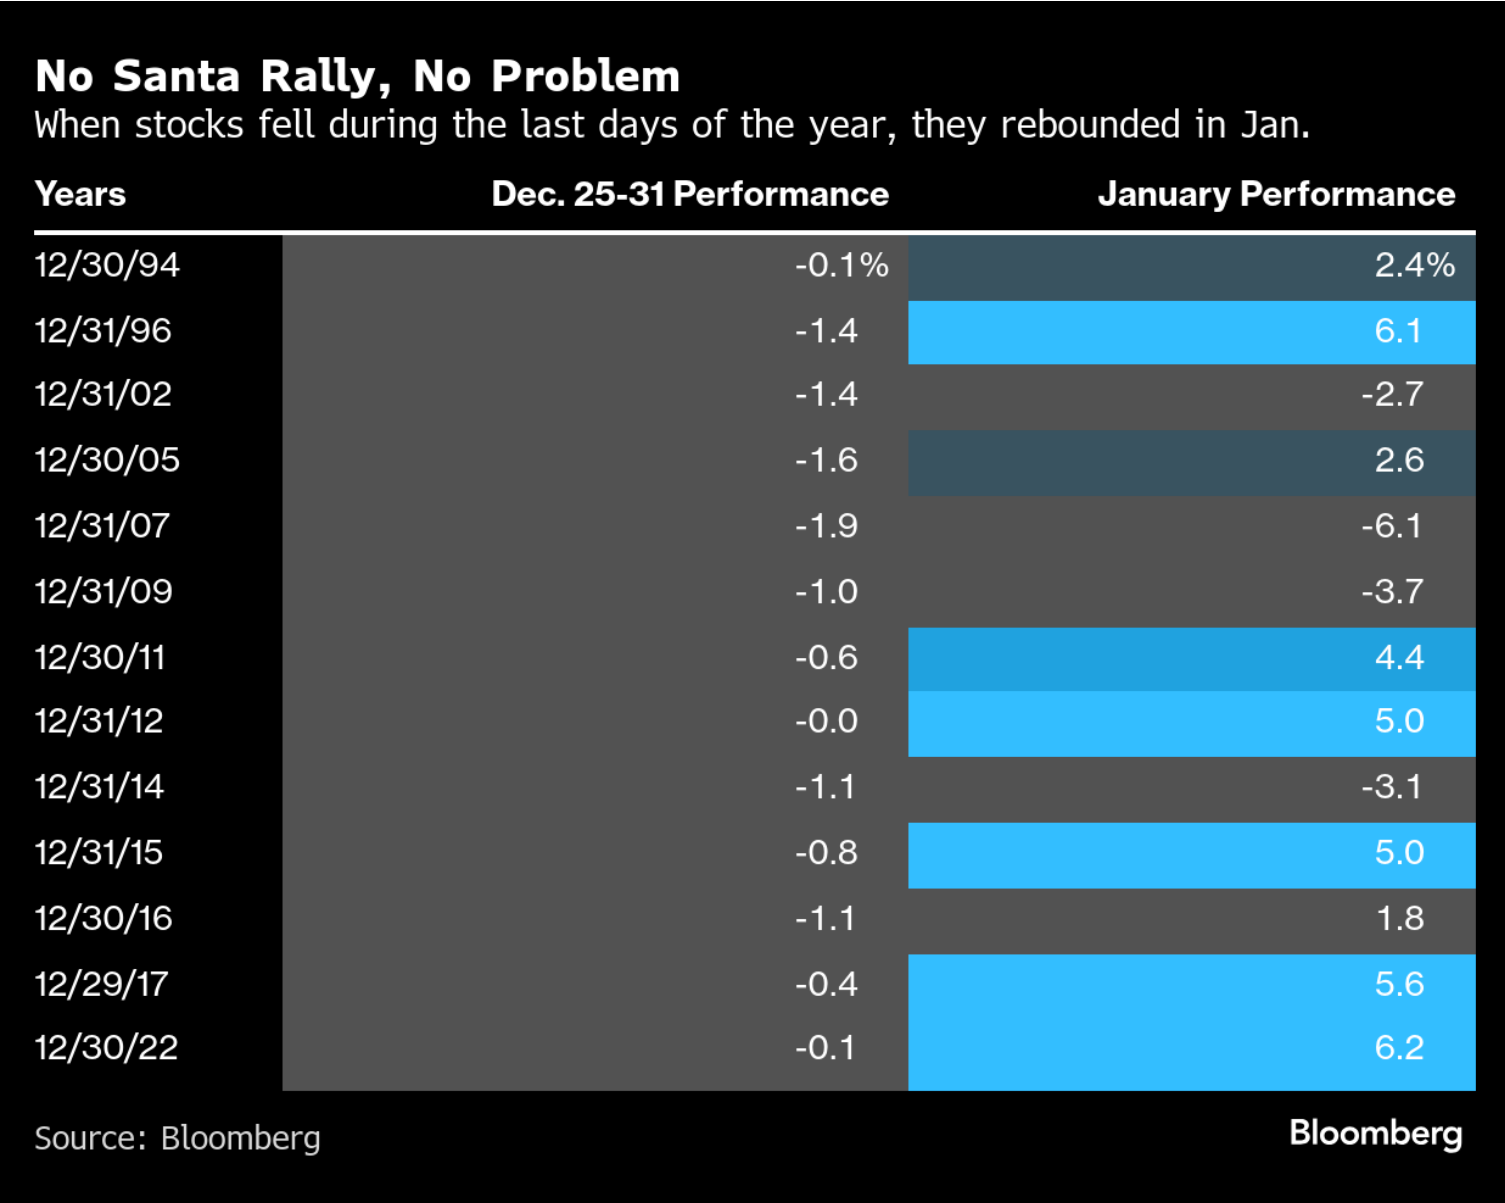
Historical Performance after weak December price action Source: Bloomberg
US100 (D1 Interval)
The Nasdaq-100 index, represented by the US100 contract, is trading below the early December high of 21,668. The mid-November high at 21,255 serves as the initial support level for bulls, with the 50-day SMA at 21,078 closely aligning with the mid-July high of 20,895, offering additional support.
For bears, key targets include the 100-day SMA at 20,427 and the August highs near 19,917, which act as critical downside levels.
The RSI is approaching a key support level that has previously served as a retracement zone, potentially signaling a pause or reversal. Meanwhile, the MACD is narrowing but continues to exhibit bearish divergence, indicating caution for bullish momentum. Source: xStation


Daily summary: Silver plunges 9% 🚨Indices, crypto and precious metals under pressure

US100 loses 1.5% 📉

Does the current sell-off signal the end of quantum companies?

Howmet Aerospace surges 10% after earnings reaching $100 bilion market cap 📈