Silver
Precious metals prices have been very volatile as of late. Gold and silver prices surged to fresh YTD highs. For gold these were also the highest levels in history. However, upward move was relatively bigger on silver than on gold. Looking at the monthly time frame, one can see that recent upward move has reached the key resistance area marked with previous reactions from 2011 and 2012. It could be a good place to start a downward correction. However upward momentum is strong, so one cannot rule out a break above the $26.5 handle. In case we see a downward correction, one should pay attention to Fibonacci retracements which should act as supports.
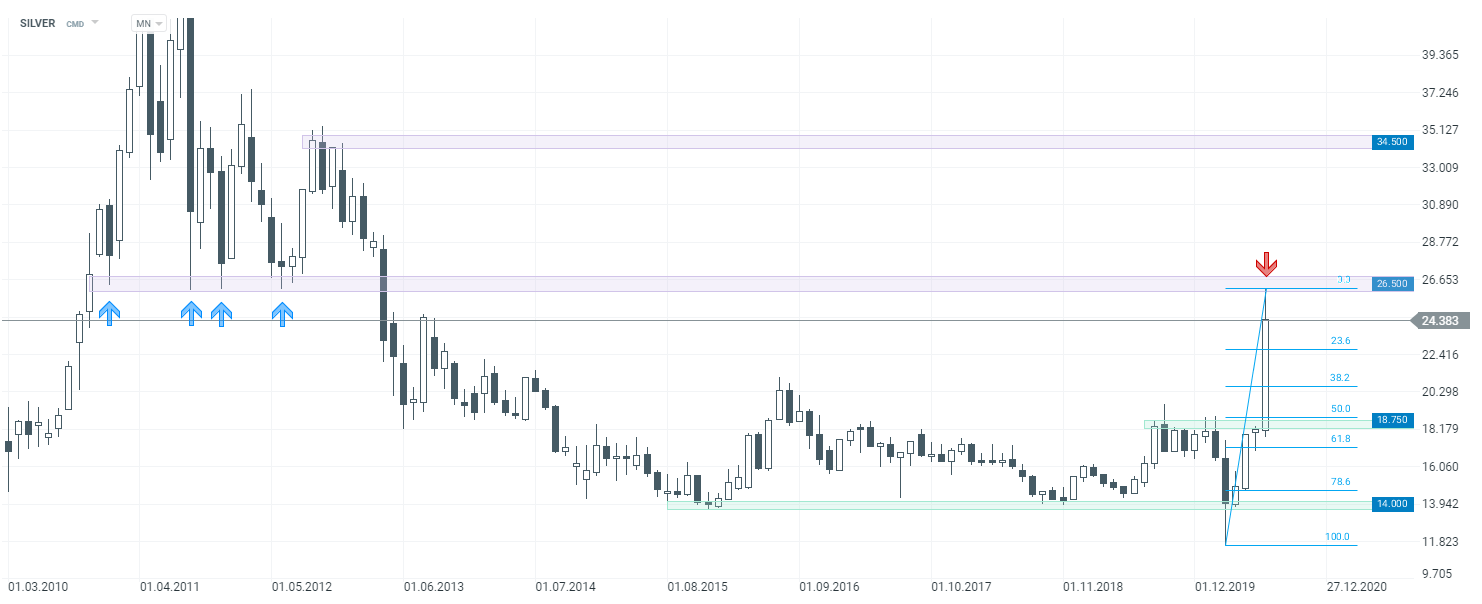 Silver MN D1 interval. Source: xStation
Start investing today or test a free demo
Create account Try a demo Download mobile app Download mobile appUS500
Mixed moods could be spotted on global stock markets at the end of the previous week. Similar indecisiveness can be spotted at the start of a new week. The upward rally slowed down, which could hint at a looming correccion. Looking at the H4 chart from a technical perspective, one can see that a head and shoulders formation (SHS) is building up. This is a structure from classical technical analysis and heralds a trend reversal. A bearish signal would be generated once the price breaks below the neckline, which lies in the vicinity of 3,190 pts. In such a scenario, a lower limit of 1:1 structure will be the first target for sellers.
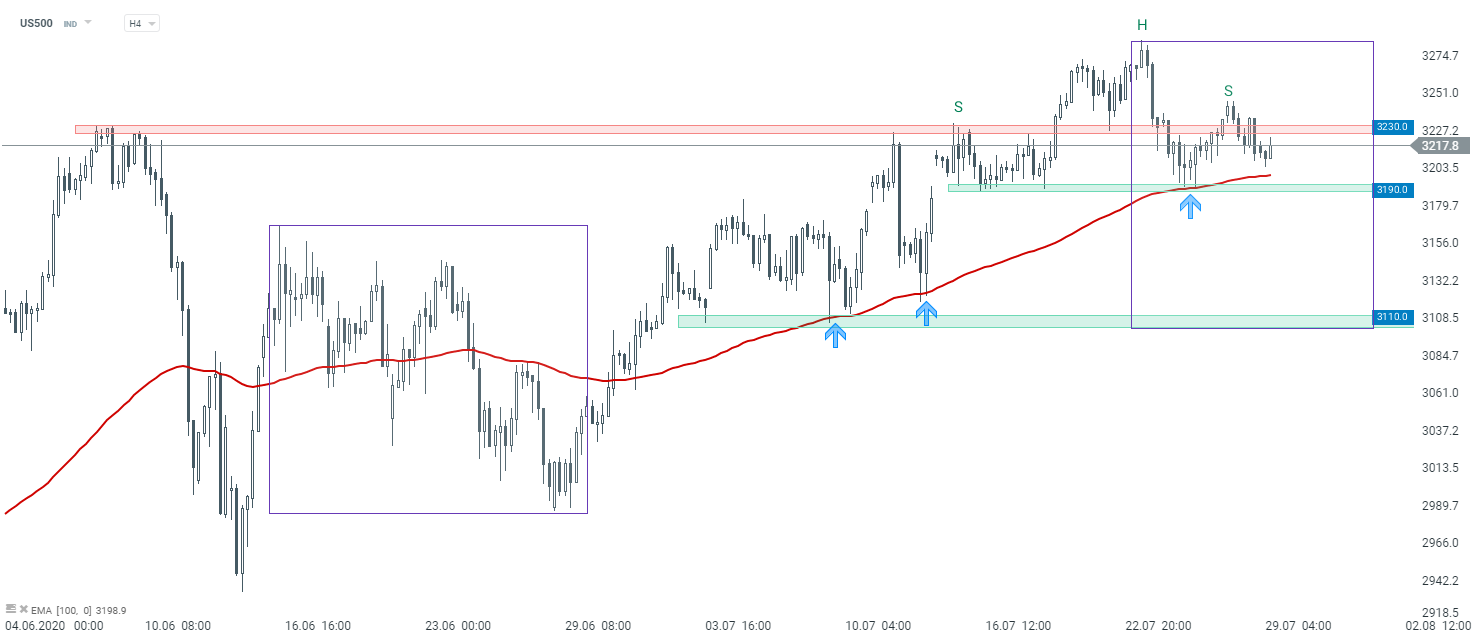 US500 H4 interval. Source: xStation
GBPUSD
GBPUSD has been trading in an upward trend recently. The pair broke above the key resistance near 1.2780 on Monday. As long as the price sits above it, the continuation of an upward trend looks probable. However, one should keep in mind that the psychological 1.30 barrier lies slightly above it. In addition, this resistance is strengthened by the 88.6% Fibonacci retracement of a recent downward swing, as well as 1:1 market geometry of the upward impulses marked with violet lines.
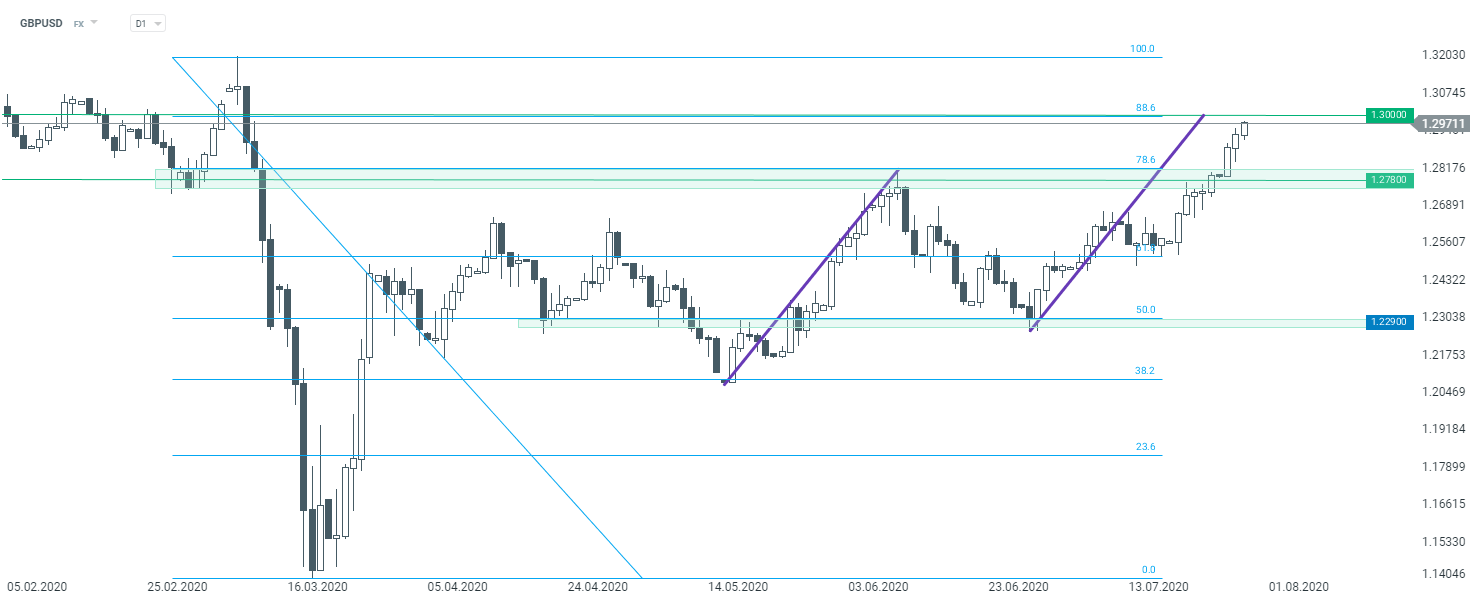 GBPUSD D1 interval. Source: xStation5
