Ethereum
Let's start today’s analysis with Ethereum. The price of this cryptocurrency reached a fresh all-time high yesterday, but a local downward correction could be observed afterwards. However, the main trend still remains upward. Looking at the H4 interval, we can see the nearest key support to watch lies in the vicinity of $1,270, where the lower limit of 1:1 structure as well as trendline can be found. Bouncing off this support may launch another upward impulse. Should a break below the $1,270 occur, downward move may accelerate.
 Ethereum H4 interval. Source: xStation5
Start investing today or test a free demo
Open real account TRY DEMO Download mobile app Download mobile appGold
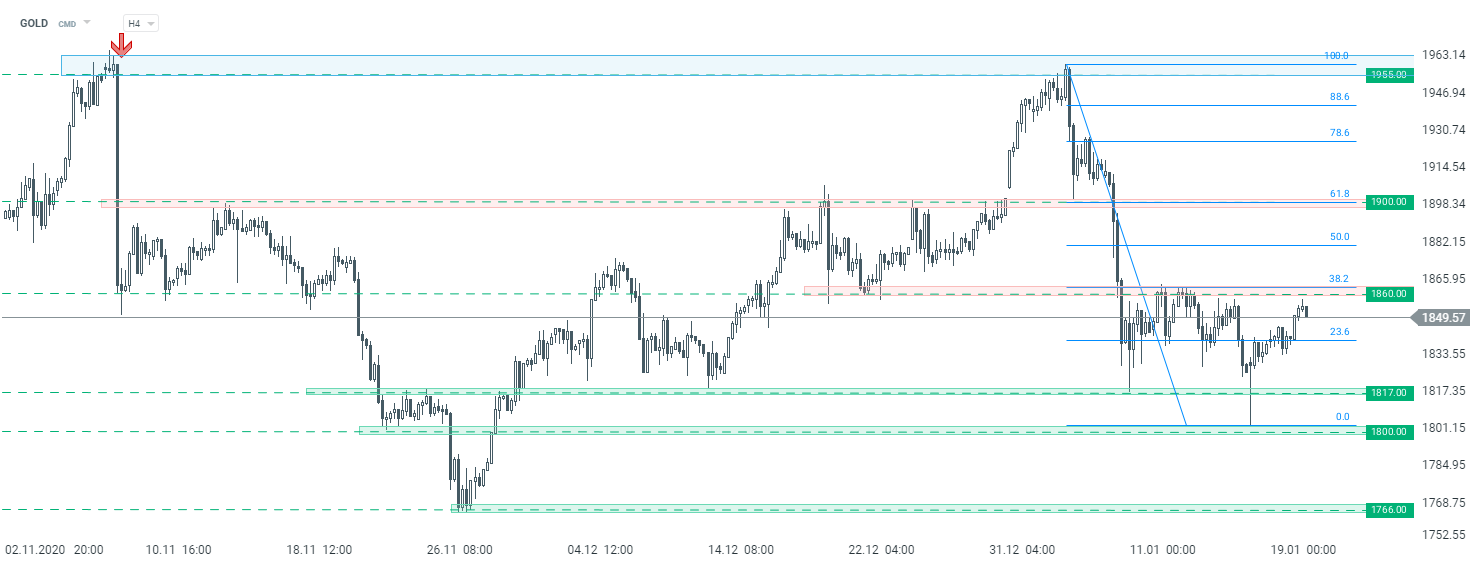
Taking a look at the Gold chart at H4 interval, one can see that the commodity is making an upward correction. The price sits slightly below the key midterm resistance at $1,860 which is marked with previous price reactions and 38.2% Fibonacci retracement. Should sellers manage to halt advance there, a resumption of a downward move may be on the cards. On the other hand, breaking above the aforementioned resistance may pave the way for a bigger upward move. In such a scenario, the next resistance to watch lies at $1,900.
 Gold H4 interval. Source: xStation5
DE30
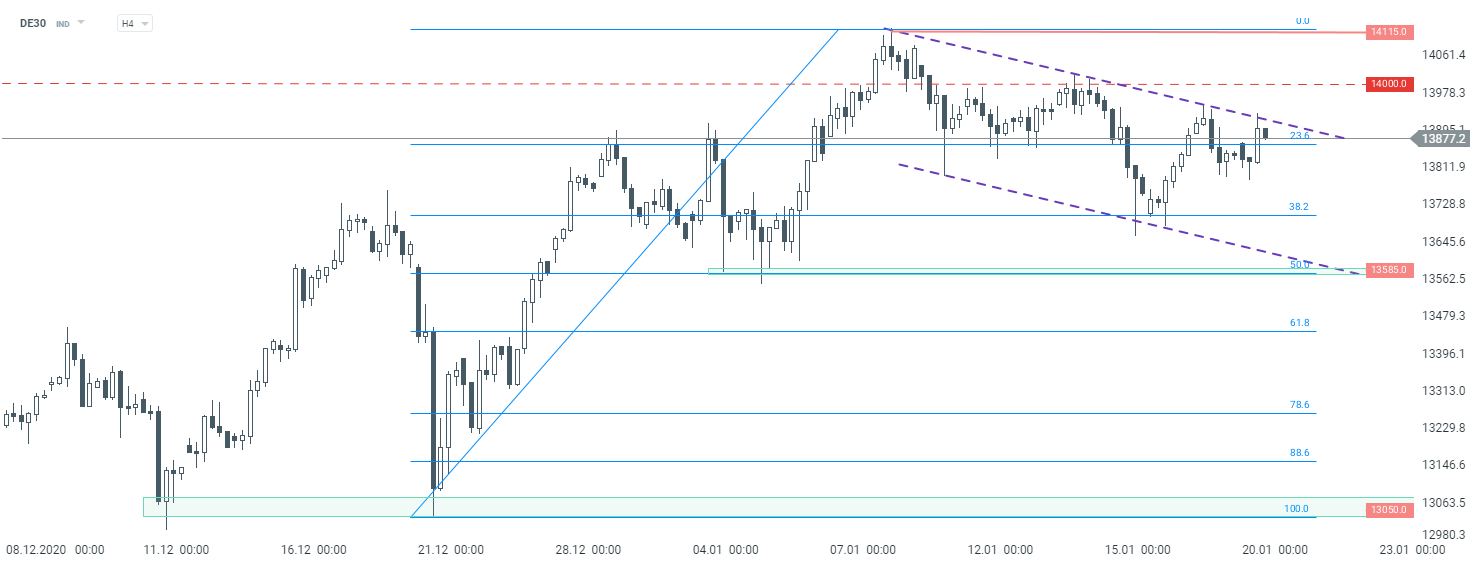
The German index has been trading in a local downward channel recently. However, the main trend remains upward. A break above the upper limit of the aforementioned channel could pave the way towards the 14,000 pts handle, or even all-time highs near 14,115 pts. On the other hand, should sellers manage to halt upward move here, DE30 could drop towards a support at 13,585 pts, where the 50% Fibonnaci retracement, recent lows as well as the lower limit of channel are located. One should also pay attention to the nearest 38.2% Fibonacci retracement, which may also act as a support.
 DE30 H4 interval. Source: xStation5
