EURUSD
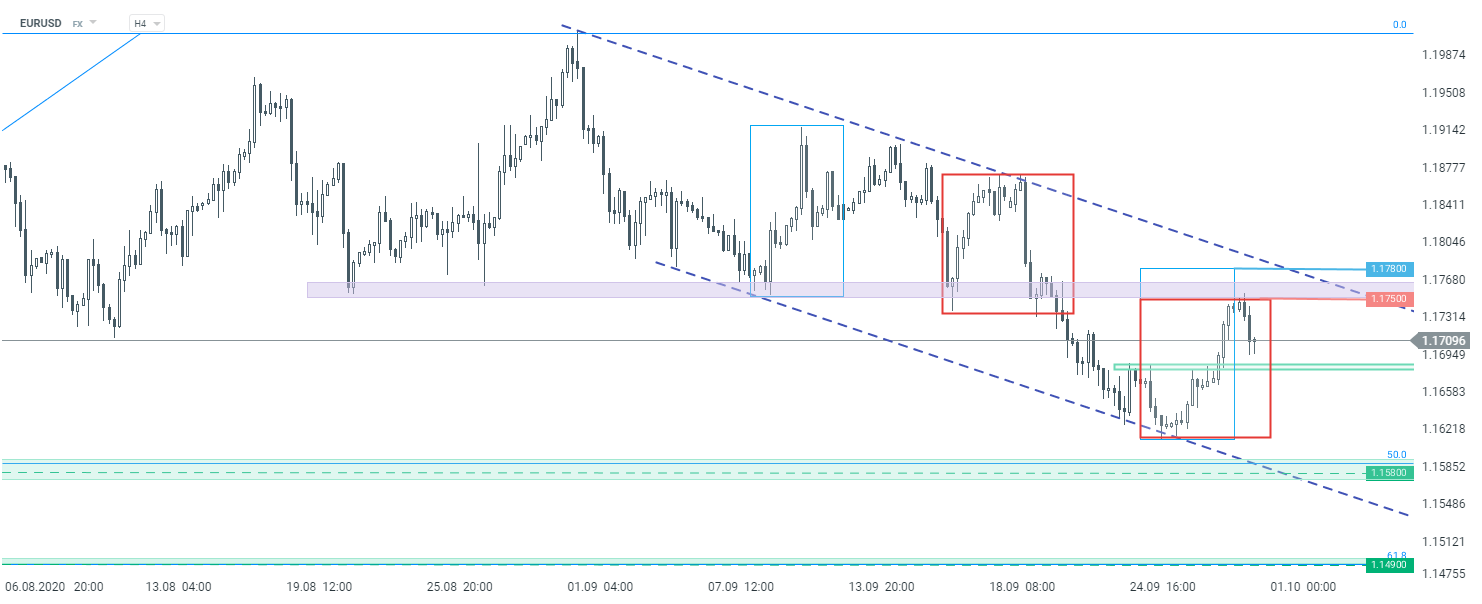
EURUSD has been trading in a downward channel recently. Looking at the H4 chart from a technical point of view, one can see that the price bounced off the key resistance area yesterday. The sellers appeared at the upper limit of local 1:1 structure, marked with red rectangles on the screen below. Bouncing off the aforementioned resistance confirmed a bearish tilt in the markets. However, if buyers manage to recoup losses and break higher, one should focus on the second geometry which lies at 1.1780 handle. Breaking above this hurdle would hint a bullish trend reversal.
 EURUSD H4 interval. Source: xStation5
Start investing today or test a free demo
Open real account TRY DEMO Download mobile app Download mobile appDE30
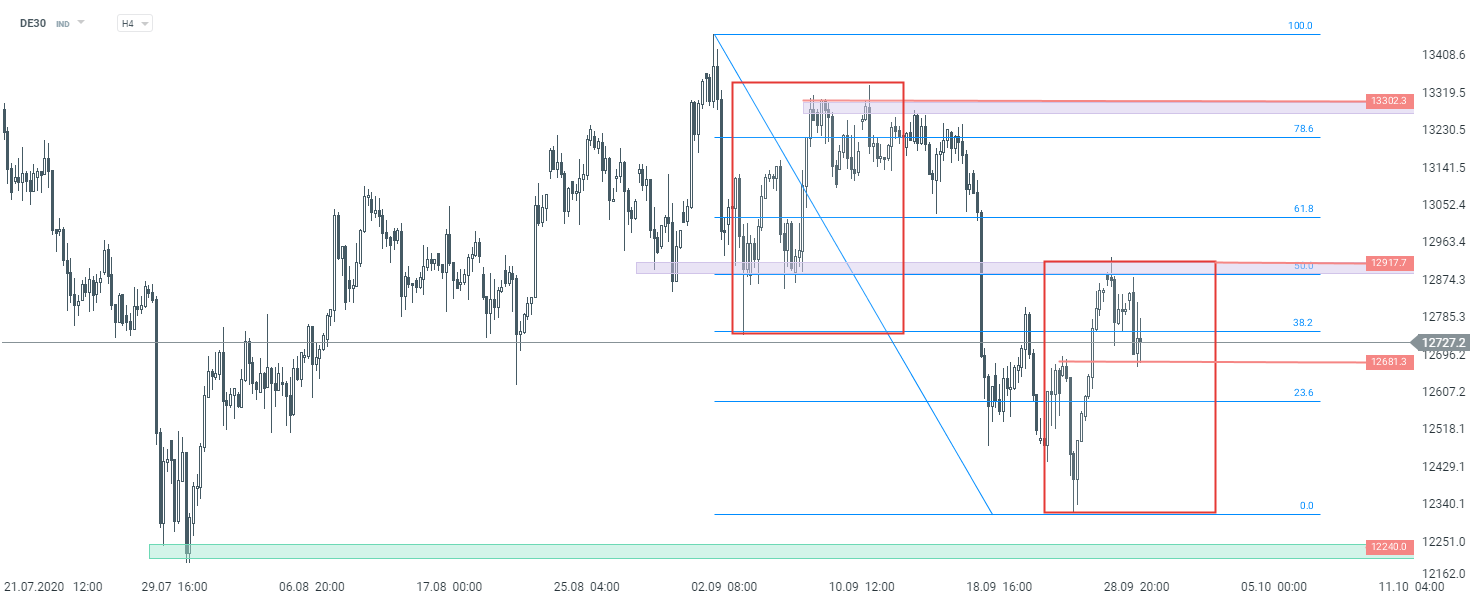
Despite a strong upward move at the beginning of a new week, buyers did not manage to break above the key resistance. Looking at the H4 interval, one can see that the price bounced off the resistance zone near 12,900 pts which is marked with previous price reactions, 50% Fibonacci retracement and the upper limit of 1:1 structure. As long as the price sits below it, continuation of a downward move looks to be a base case scenario. Should the price break above 12,900 pts, the upward move may extend towards the 13,300 pts handle.
 DE30 H4 interval. Source: xStation5
OIL.WTI
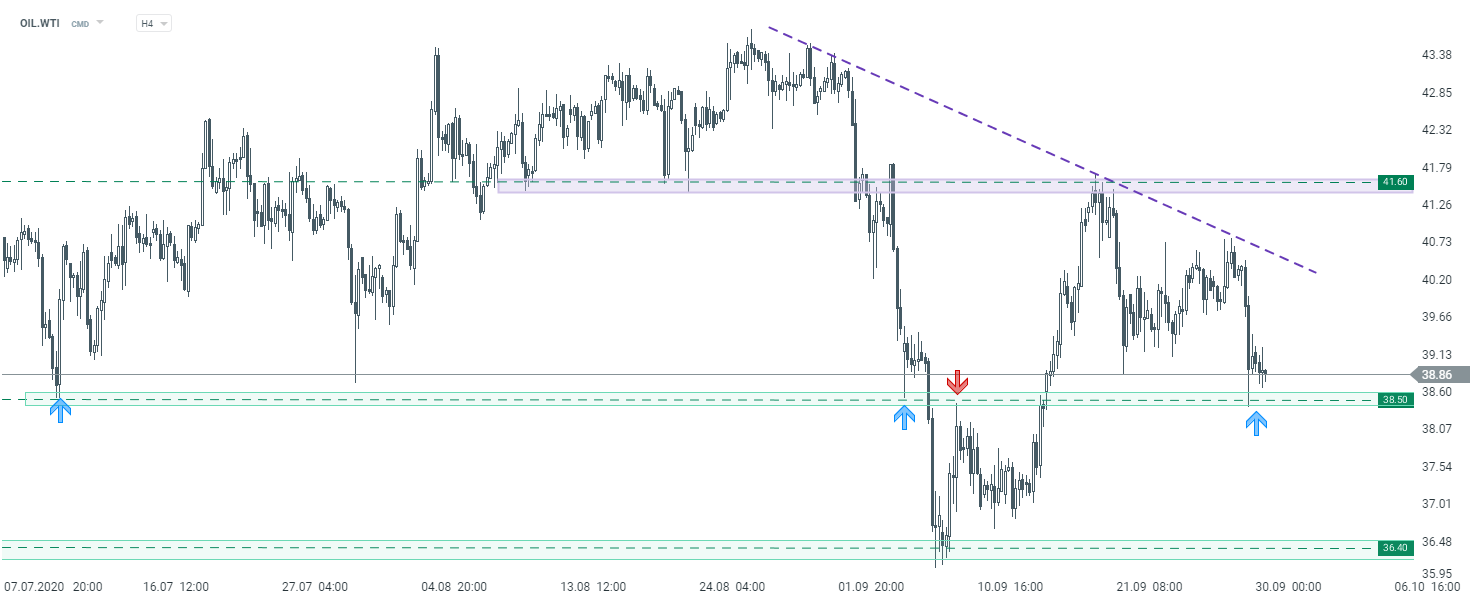
A strong downward move could have been spotted on the oil market yesterday. However, looking at the H4 interval, we can see the decline was halted by a key support levels. Area marked with green color at $38.5 results from previous price reactions. If buyers manage to keep the price above it, the upward move could be on the cards. On the other hand, should the price break below, the downward move may deepen towards recent lows at $36.40. One should also remember that the market may become more volatile once the DOE report is released at 3:30 pm BST.
 OIL.WTI H4 interval. Source: xStation5
