Investors were offered the first Q4 earnings reports from US banks today before the opening of the Wall Street cash session. Among today's earnings reporters one could find BlackRock, Wells Fargo, JPMorgan and Citigroup. Highlights from each report have been listed below.
BlackRock (BLK.US)
- Revenue: $4.63 billion vs $4.63 billion expected (+6.8% YoY)
- Investment advisory performance fees: $311 million vs $219.3 million expected (+36% YoY)
- Base fees and securities lending: $3.61 billion vs $3.64 billion expected (+6.1% YoY)
- Technology services: $379 million vs $391 million expected (+7.4% YoY)
- Net inflows: $95.65 billion vs $128.37 billion expected
- Long-term: $62.70 billion vs $96.85 billion expected
- Equity: $34.09 billion vs $39.15 billion expected
- Fixed Income: 32.18 billion vs $35.48 billion expected
- Institutional: -$16.07 billion
- Retail: -$8.96 billion
- Adjusted EPS: $9.66 vs $8.88 expected ($8.93 a year ago)
- Assets under management: $10.01 trillion vs $9.78 trillion expected (+16% YoY)
- Operating Margin: 34.2% vs 34.9% expected (32.9% a year ago)
- Total expenses: $3.05 billion vs $3.01 billion expected (+4.7% YoY)
- Approves 2% increase in quarterly dividend to $5.10 per share
- Agrees to buy Global Infrastructure Partners for $12.5 billion
 BlackRock (BLK.US) trades more or less flat in pre-market today, after reporting better-than-expected earnings and in-line revenue. Stock has recently experienced a downward correction and retested the $775 price zone. Source: xStation5
Wells Fargo (WFC.US)
- Revenue: $20.48 billion vs $20.35 billion expected
- Commercial banking: $3.37 billion vs $3.29 billion expected
- Corporate and investment banking: $4.74 billion vs $4.32 billion expected
- Wealth & investment management: $3.66 billion vs $3.64 billion expected
- Net interest income: $12.77 billion vs $12.77 billion expected
- EPS: $0.86
- Total average loans: $938 billion vs $942 billion expected
- Total average deposits
- Efficiency ratio: 77% vs 67% expected
- Net interest margin: 2.92% vs 2.95% expected
- Return on equity: 7.6% vs 8.6% expected
- Common equity Tier 1 ratio: 11.4% vs 10.9% expected
- Provision for credit losses: $1.28 billion vs $1.32 billion expected
- Expects 2024 net interest income to be potentially 7-9% YoY low
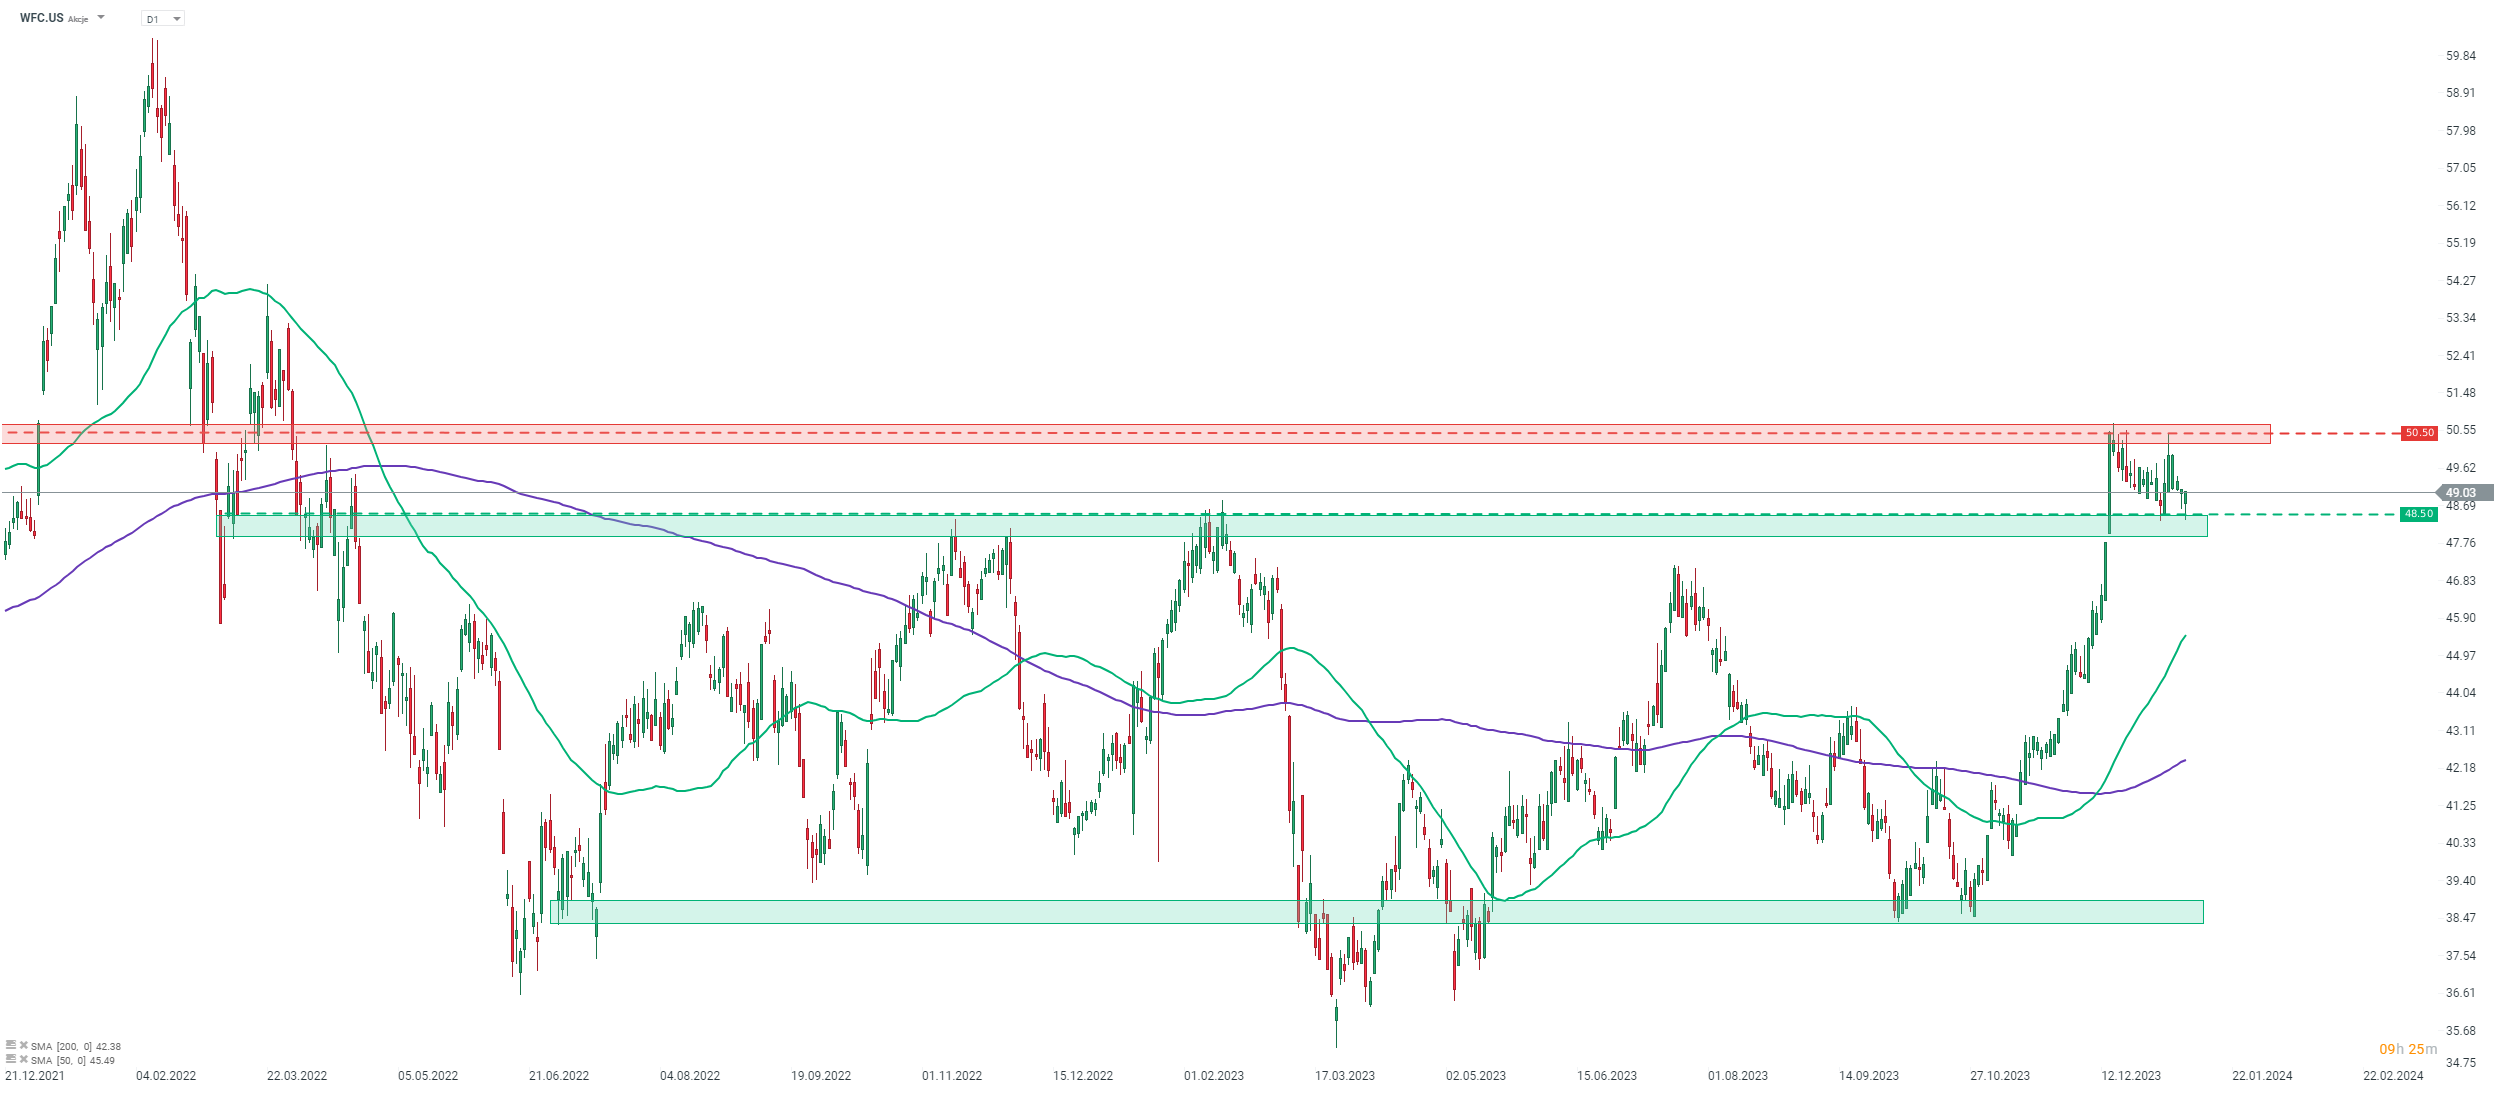
 Wells Fargo (WFC.US) trades slightly lower in pre-market in spite of a beat in Q4 sales. Stock has broken above the upper limit of trading range at $48.50 recently but has struggled to maintain bullish momentum since. Source: xStation5
JPMorgan (JPM.US)
- Adjusted revenue: $39.94 billion vs $40.23 billion expected (+12% YoY)
- Fixed income trading: $4.03 billion vs $3.84 billion expected (+7.9% YoY)
- Equity trading: $1.78 billion vs $1.93 billion expected (-7.9% YoY)
- Investment banking: $1.58 billion vs $1.72 billion expected (+13% YoY)
- CIB Markets: $5.81 billion vs $5.77 billion expected (+2.5% YoY)
- EPS: $3.04 ($3.57 a year ago)
- Loans: $1.32 trillion vs $1.32 trillion expected (+17% YoY)
- Deposits: $2.40 trillion vs $2.36 trillion expected
- Provision for credit losses: $2.76 billion vs $2.42 billion expected (+21% YoY)
- Net charge-offs: $2.16 billion vs $1.9 billion expected
- Managed net interest income: $24.18 billion vs $23.01 billion expected (+19% YoY)
- Standardized Common Equity Tier 1 ratio: 15% vs 14.3% expected
- Return on equity: 12% vs 13.8% expected
- Assets under management: $3.42 trillion vs $3.32 trillion expected
- Expects full-year net interest income at around $90 billion (exp. $86.1 billion)
- Expects full-year adjusted expenses at around $90 billion
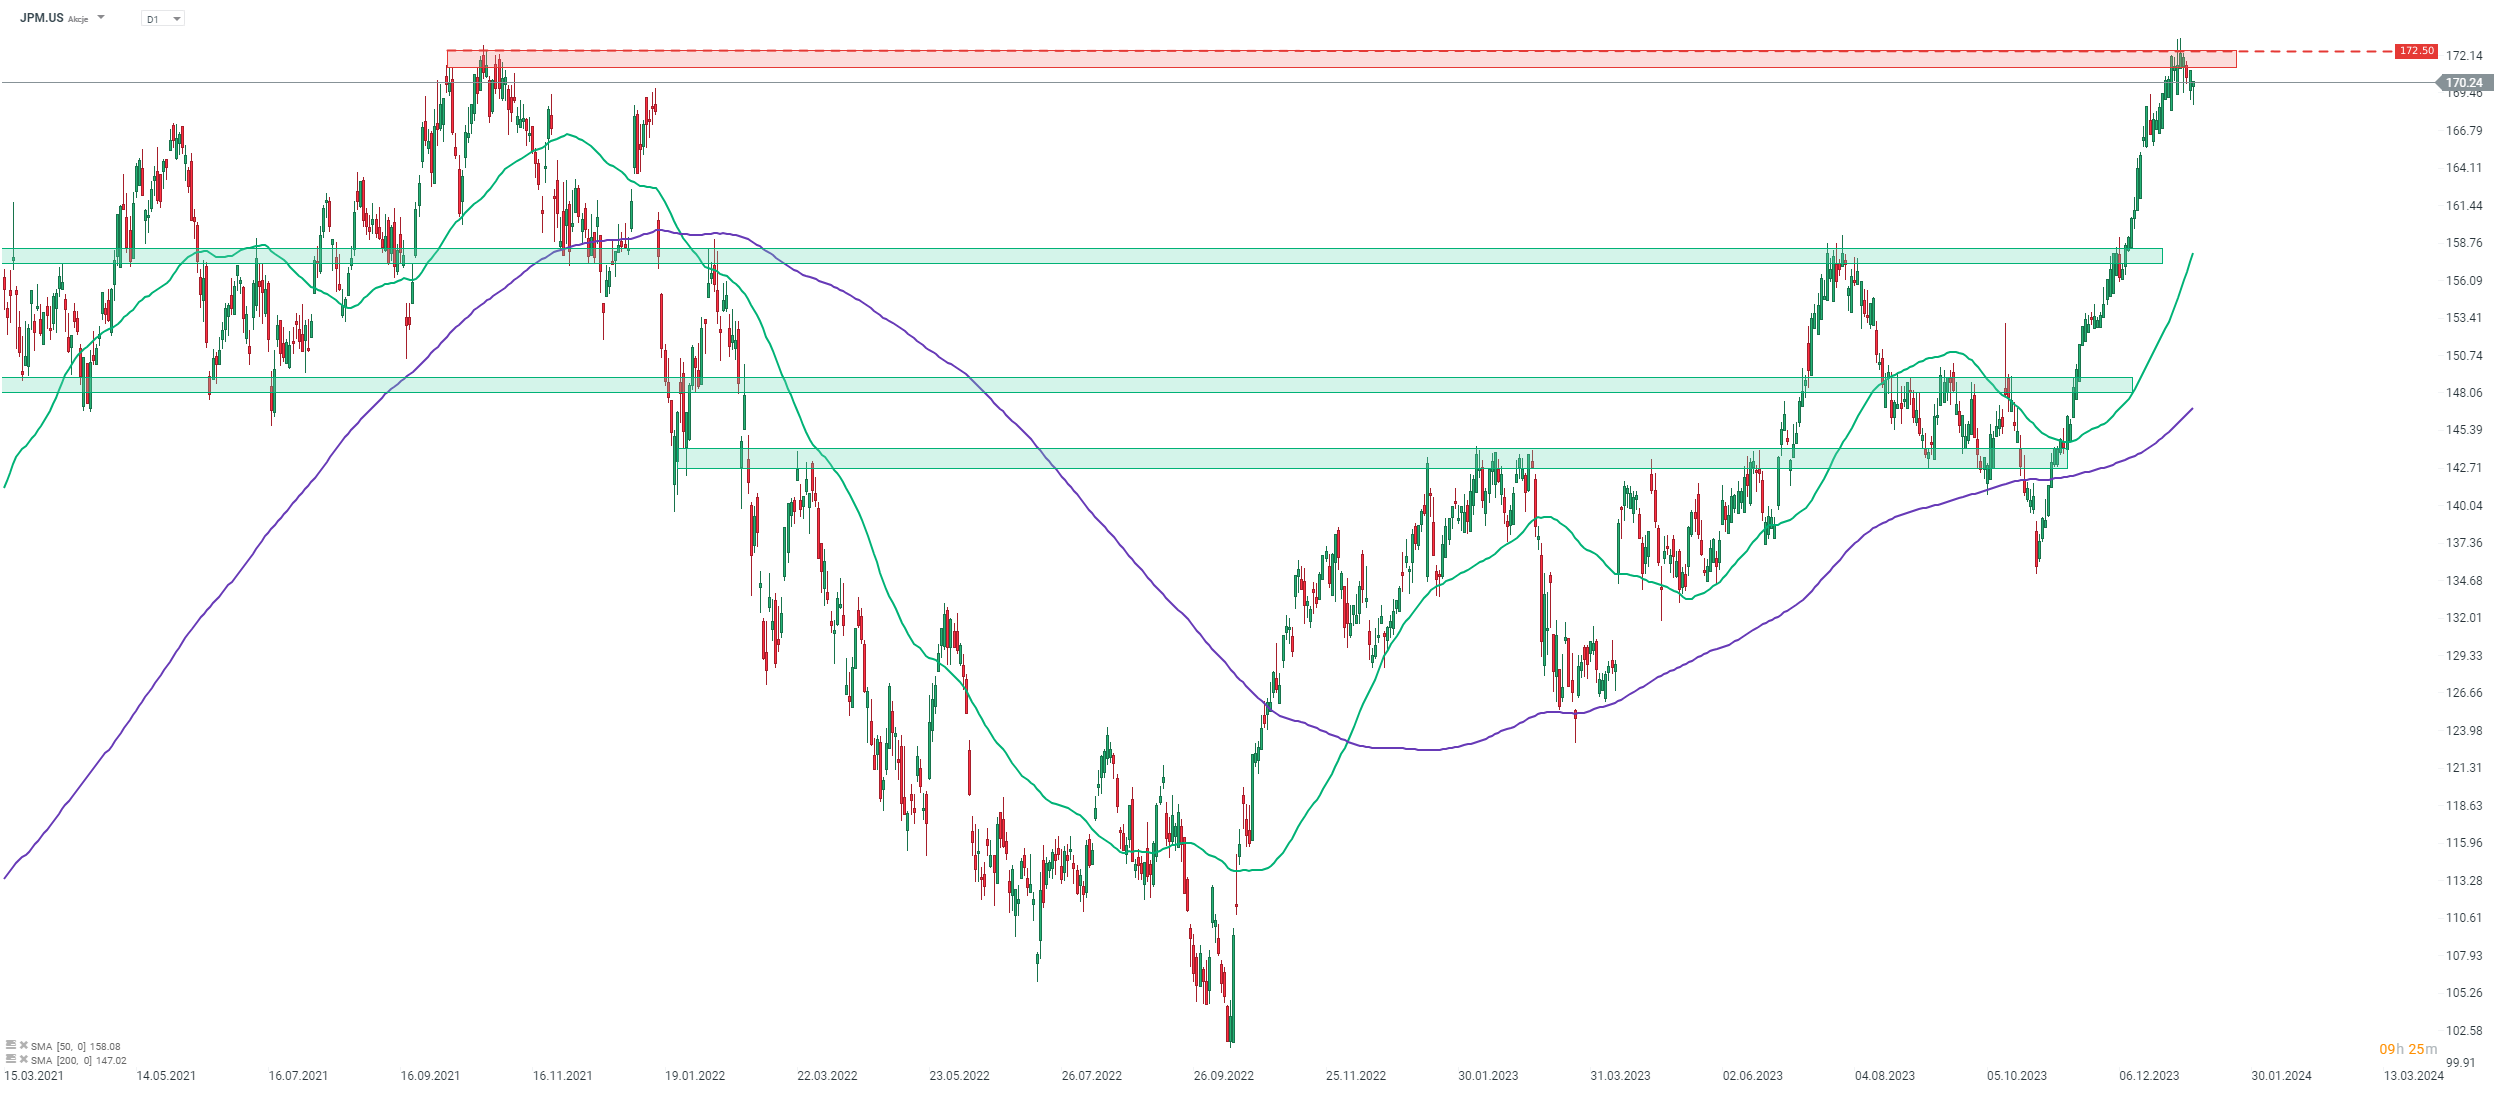
 JPMorgan (JPM.US) gains in pre-market in spite of a miss in Q4 revenue. Stock pulled back recently but continues to trade near $172.50 resistance zone marked with 2021 highs. Source: xStation5
Citigroup
- Revenue: $17.44 billion vs $18.68 billion expected
- Adjusted EPS: $0.84
- Common equity Tier 1 ratio: 13.3% vs 13.6% expected
- Return on average equity: -4.5% vs +1.79% expected
- Net charge-offs: $1.99 billion vs $1.87 billion expected
- Operating expense: $16.0 billion
- Total loans: $689.4 billion vs $671.42 billion expected
- Total deposits: $1.31 trillion
- Efficiency ratio: 91.7%
- Expects full-year revenue at around $80-81 billion
- Expects full-year adjusted expense at around $53.5-53.8 billion
- Citi plans reduction in headcount by 20k over medium term
- Will evaluate buybacks on quarter-by-quarter basis
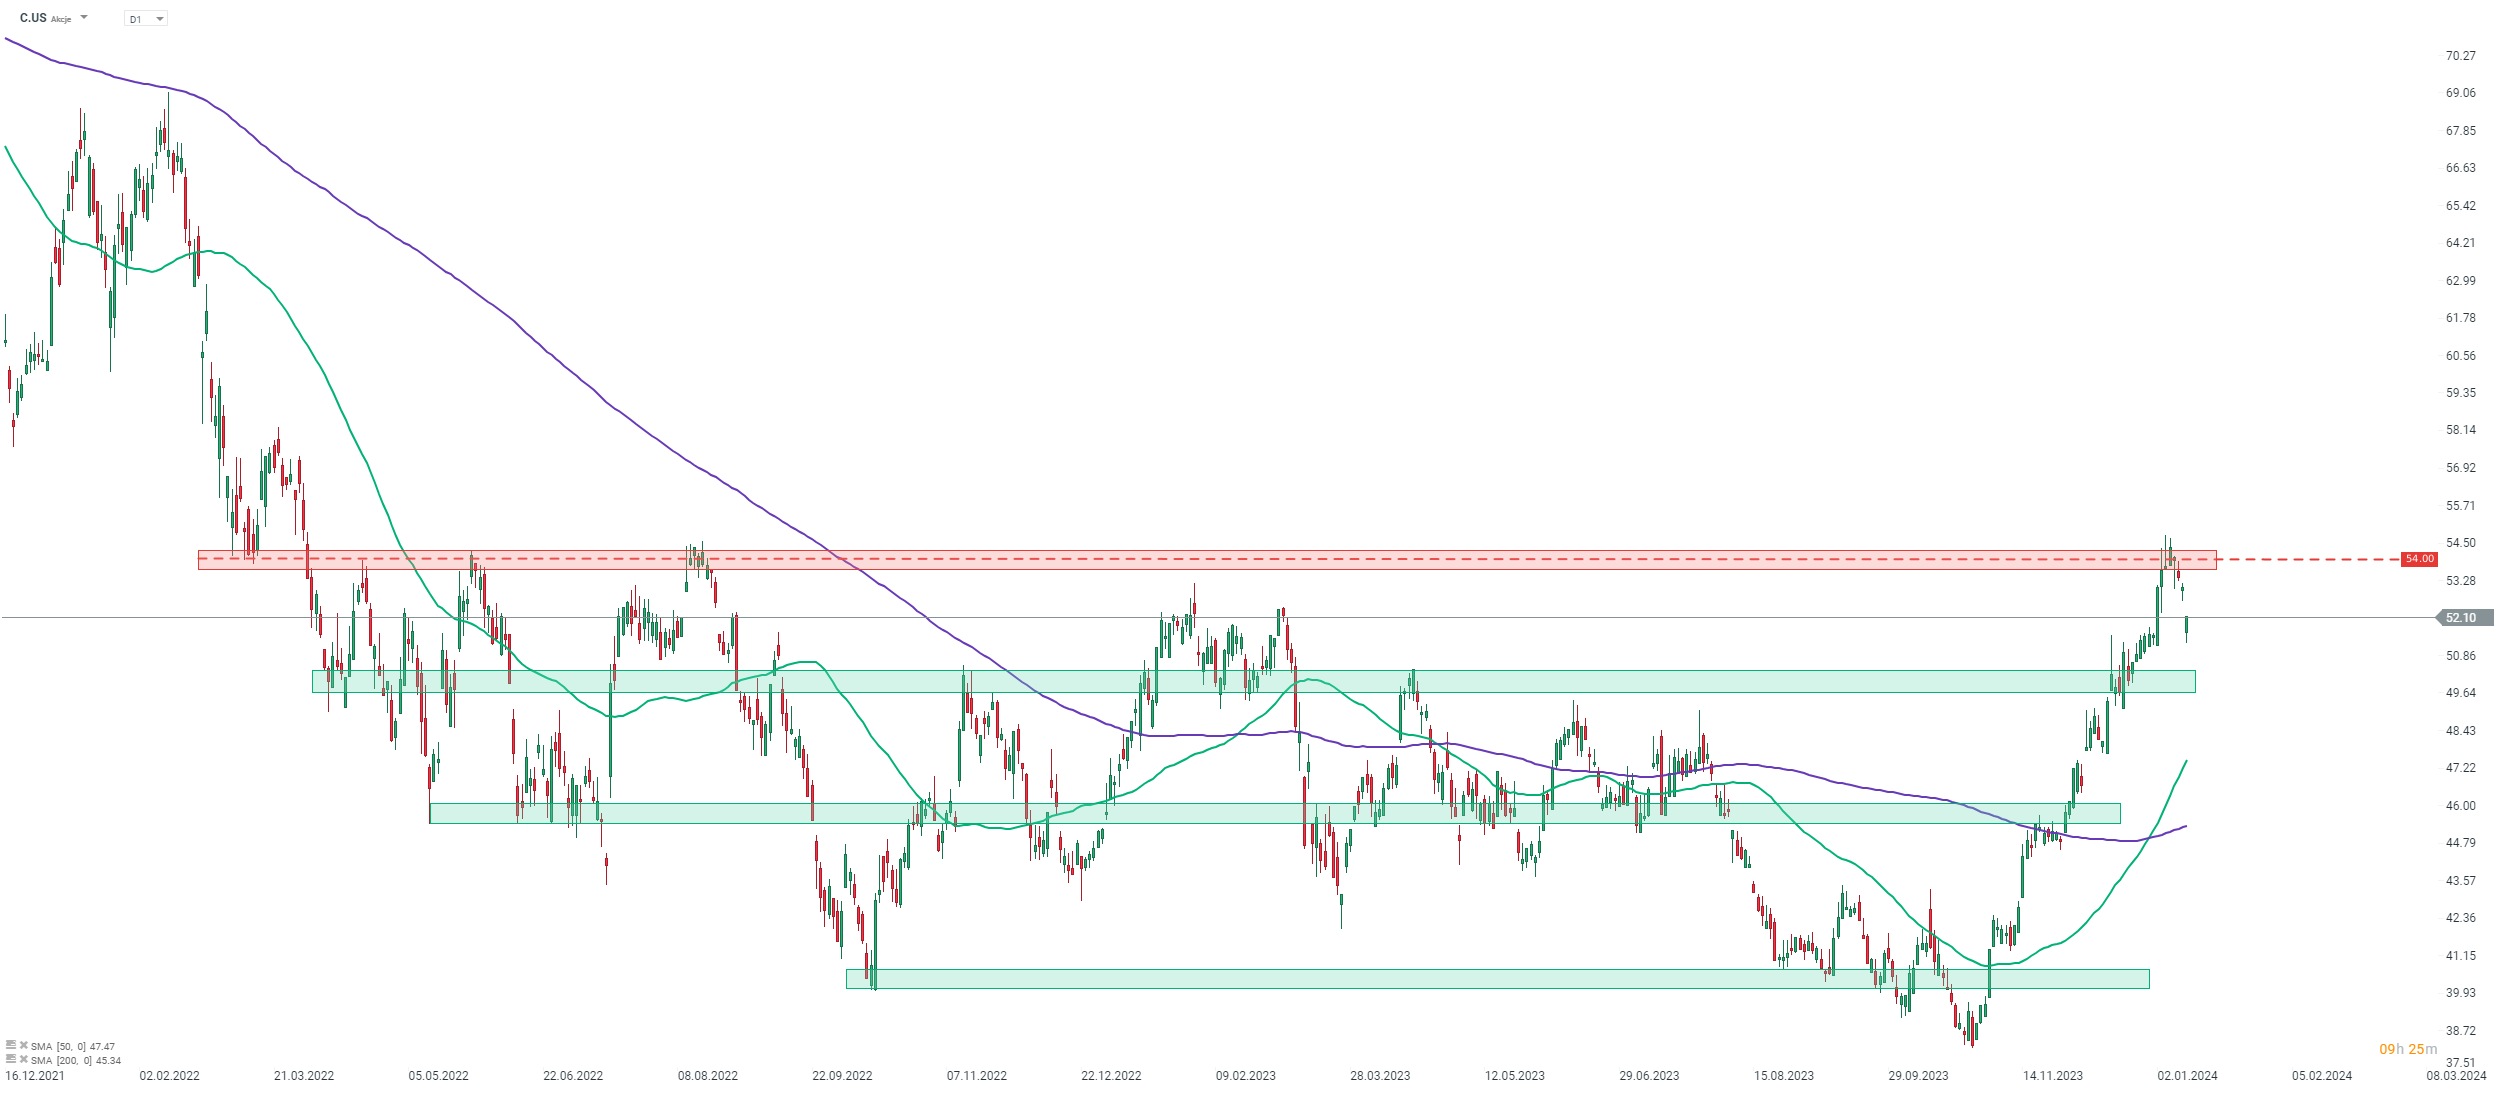
 Citigroup (C.US) gains in premarket in spite of a rather disappointing Q4 earnings. Overall, stock is pulling back, following a failed attempt at breaking above the $54 resistance zone. Source: xStation5

Palo Alto acquires CyberArk. A new leader in cybersecurity!

US OPEN: Blowout Payrolls Signal Slower Path for Rate Cuts?

Market wrap: Oil gains amid US - Iran tensions 📈 European indices muted before US NFP report

Economic calendar: NFP data and US oil inventory report 💡


