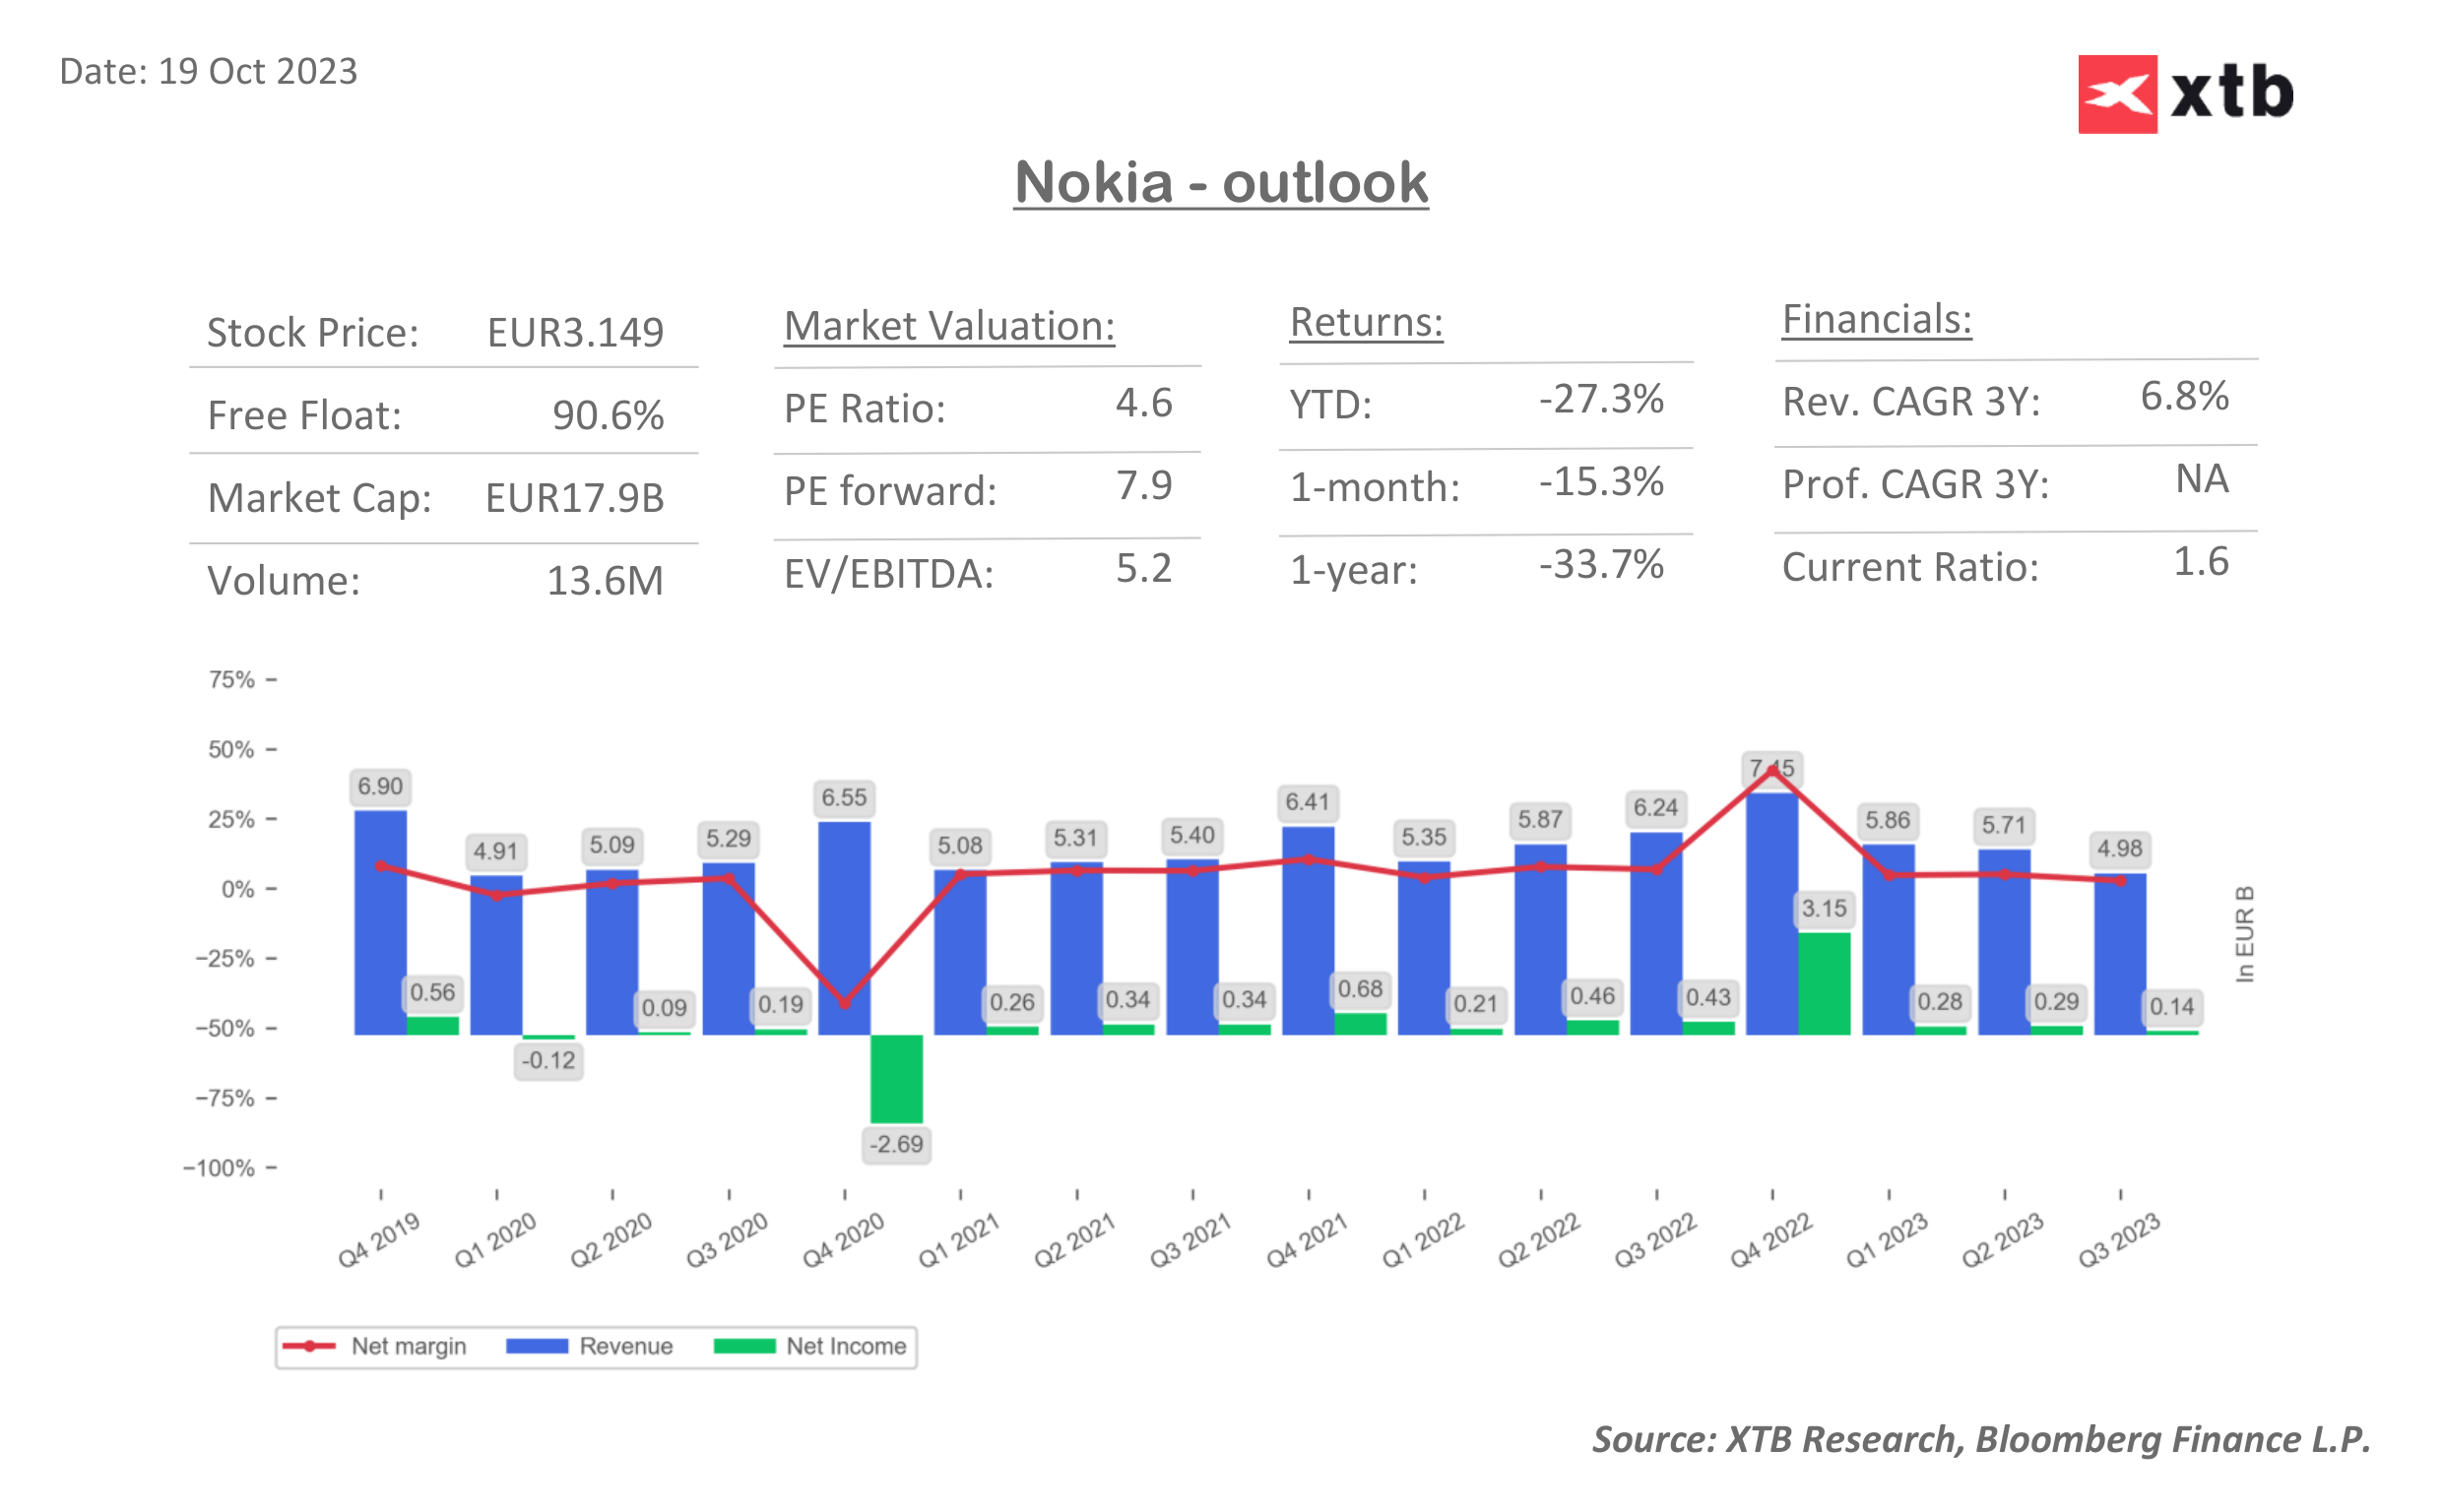
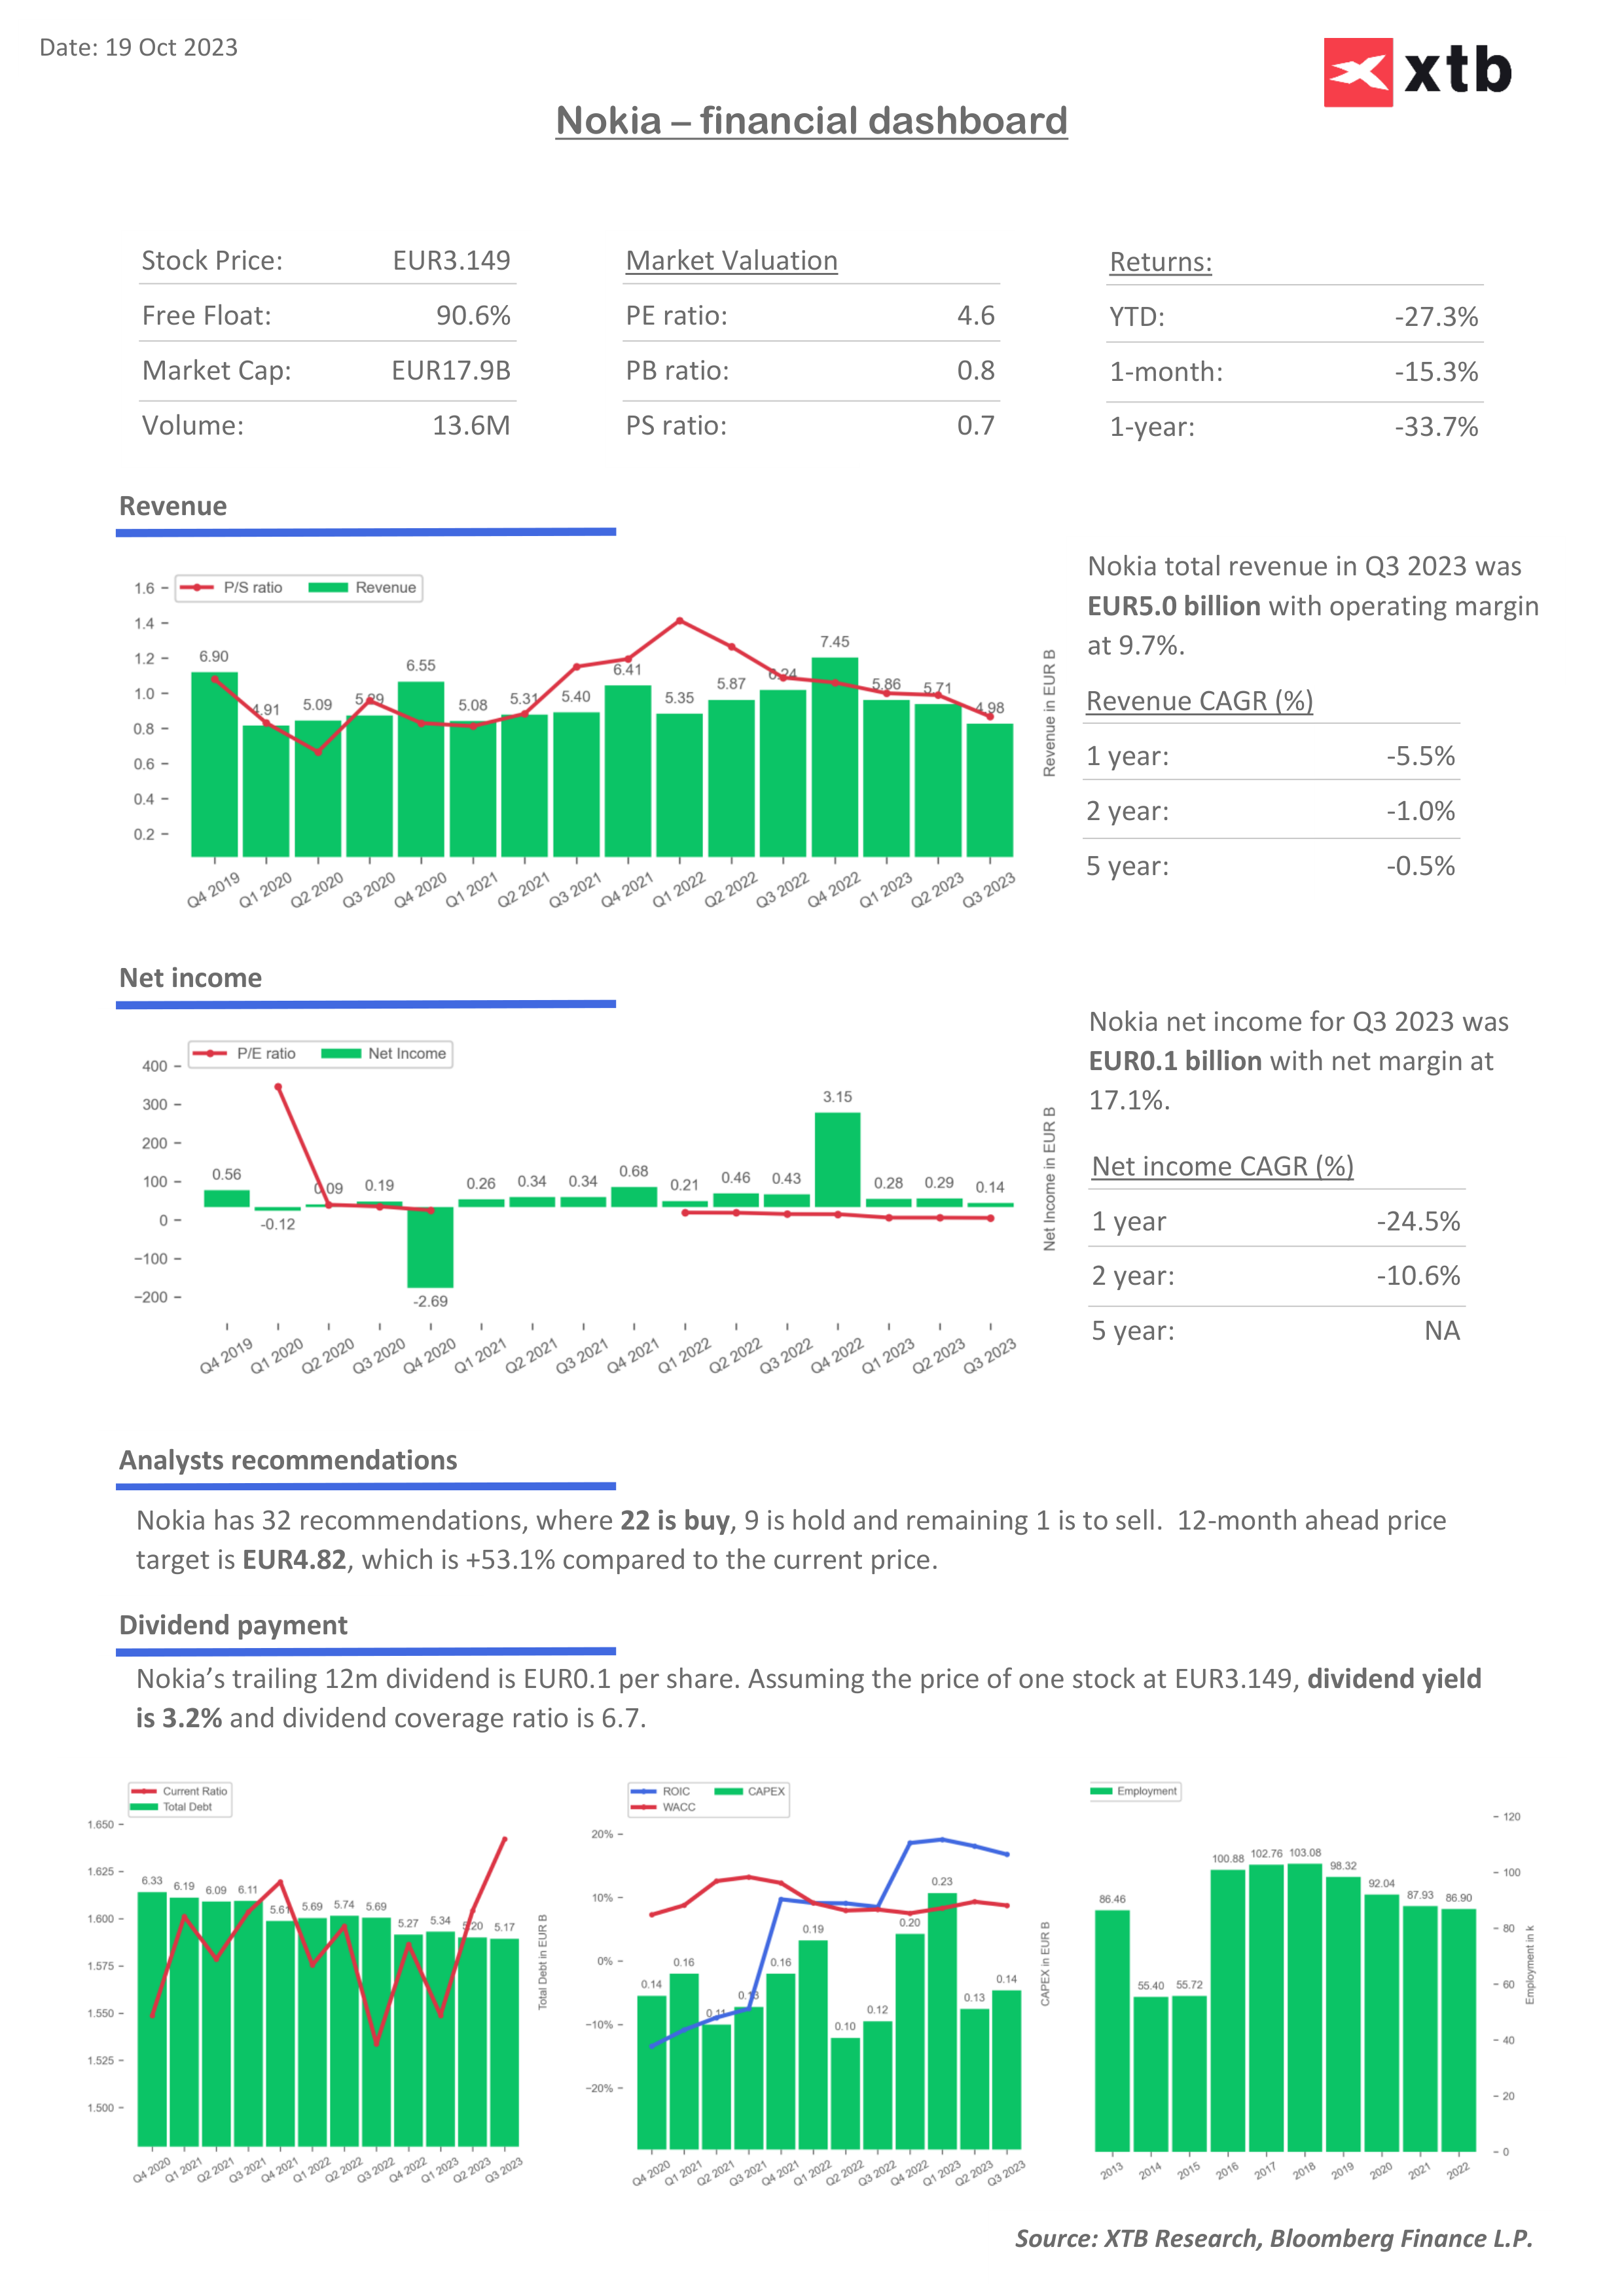
Sales: EUR 4.98 billion vs. EUR 5.67 billion forecasts
Earnings per share (EPS): €0.02 vs. €0.05 a year earlier
- Comparable sales fell 15% y/y. The company plans to lay off up to 14,000 employees from 86,000 currently to 72,000
- U.S. market demand weakens. The company cited consumer weakness in an environment of inflation and higher interest rates dampening demand
- Gross margin fell to 38.9% from 39.2% a year earlier. The company aims to save between €800 million and €1.2 billion by 2026
- Comparable operating margin fell year-on-year by 2% to 8.5%, which Nokia pointed to as evidence of profitability despite falling net sales
Nokia - weak but still optimistic?
- According to Nokia, working capital difficulties will subside from the current fourth quarter. The company also announced a strategy to give more autonomy to business groups to support the profitability of the business model. It sees long-term hope in the form of network services in the face of the AI and cloud computing trend, and sees current consumer weakness more as a temporary seasonal factor.
- Management's comments indicate that the company believes in the significant progress it has made over the past three years and the return on its investments over the long term. The company continues to expect full-year 2023 net sales in the range of €23.2 billion to €24.6 billion, with operating margins in the range of 11.5% to 13.0%.
- Network infrastructure revenues fell 14% y-o-y For mobile networks, net sales fell 19%, (slowing 5G deployment in India did not offset weaker results from the US). Cloud and network services proved stronger, falling 2% y/y with still strong corporate demand
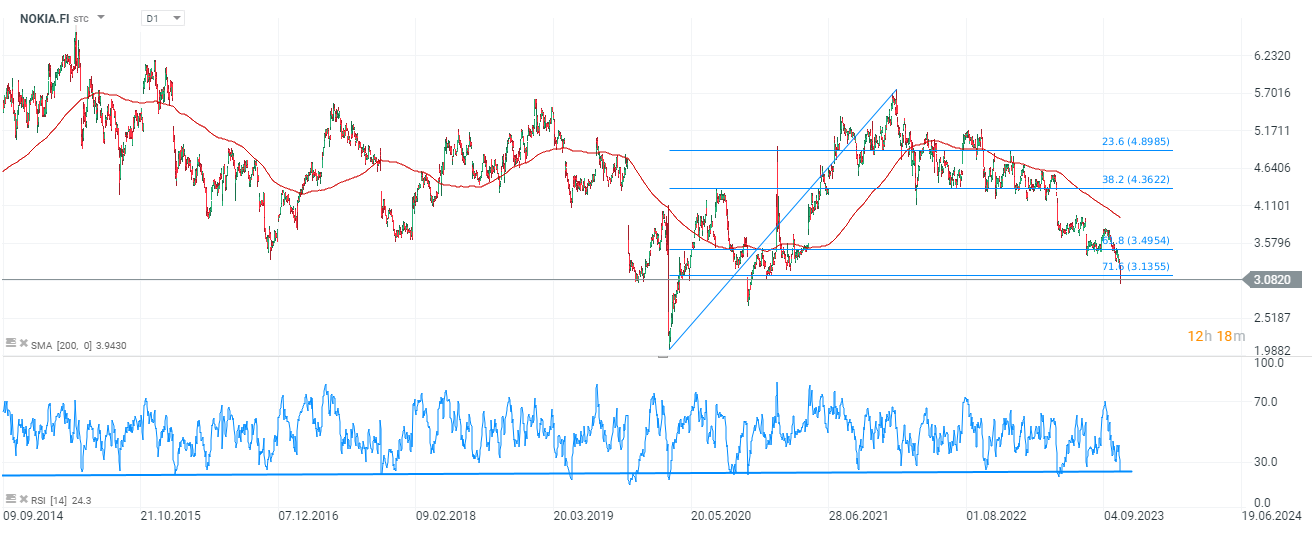
Nokia (NOKIA.FI) stock chart D1 interval
The company's shares are trading more than 5% oversold today and are trading around the 71.6 Fibonacci retracement of the March 2020 upward wave at €3.13 per share.On the daily interval, the RSI indicator is around 24 points - an extreme oversold level, and from these levels historically the stock has often come out eventually on the defensive by starting a rebound. The key resistance is around EUR 3.9 - 4, where the average SMA200 (red line) is located.

Source: xStation5
Nokia expectations and valuation

 Source: XTB Research, Bloomberg Finance LP

Palo Alto acquires CyberArk. A new leader in cybersecurity!

US OPEN: Blowout Payrolls Signal Slower Path for Rate Cuts?

Market wrap: Oil gains amid US - Iran tensions 📈 European indices muted before US NFP report

Economic calendar: NFP data and US oil inventory report 💡


