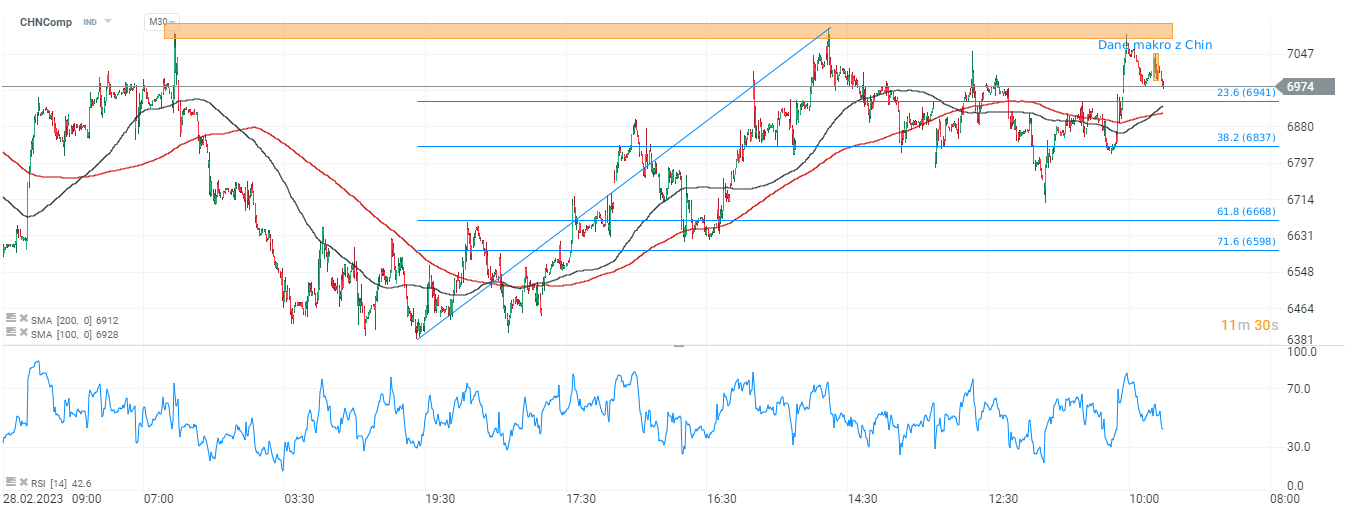
Today financial markets awaited readings of key data from China. Although the data was good, the reaction of Chinese indices including CHNComp is nevertheless mixed, which may indicate 'fact selling'. Positive surprises came from robust growth in GDP, retail sales and a drop in unemployment, but industrial production sent a mixed signal, as did investment in urban areas:
- Industrial production was 3.9% y/y vs. 4.4% forecast and 2.4% previously
- China's GDP was 4.5% y/y vs. 4% forecast and 2.9% previously
- China's GDP was 2.2% q/q vs. 2% forecast and 0% previously
- Urban investment was 5.1% y/y vs. 5.7% expected and 5.5% previously
- Retail sales were 10.6% y/y vs. 7.5% forecast and 3.5% previously
- Unemployment was 5.3% vs. 5.5% expected and 5.6% previously
After years of lockdown, consumers in China appear to be behaving similarly to the situation in Western countries as economies began to open up after the covid wave. The spending frenzy may be supporting corporate revenues. Additionally, it still hasn't resulted in higher inflation, so the PBOC isn't forced to act to cool demand. The food service sector is doing great. Nonetheless, private investment is still under pressure, and youth unemployment is high, which may indicate that potential employers are cautious about long-term business prospects. Lower-than-expected industrial production growth may also indicate this.
GDP is doing well, growing by 3% last year and missing the 5.5% estimate by a powerful margin, mainly due to Chinese government policies. The IMF expects China's GDP to grow 5.2% this year and maintain that trend next year, which is in line with the 'policy target' and China's forecast. Nevertheless, there are still claims that the current excellent macro data is largely due to the low base effect. According to ANZ Research, after adjusting for the impact of lagging economic activity, Q1 GDP growth may have been as low as 2.6%. Real estate investment, still scored a 5.8% y/y decline in Q1, with sales measured by floor space falling 1.8%.
 CHNComp chart, M30 interval. This is the third time since the beginning of March that the index has reacted with supply above 7,000 points. Key levels to watch at the moment are the SMA100, SMA200 and the 23.6 and 38.2 Fibonacci retracement further supported by past price reactions. Source: xStation5

Morning Wrap: Dollar in a trap, all eyes on NFP 🏛️(February 11, 2026)

Daily summary: Weak US data drags markets down, precious metals under pressure again!

US Open: Wall Street rises despite weak retail sales

BREAKING: US RETAIL SALES BELOW EXPECTATIONS


