Oil
-
Oil prices experienced the biggest weekly jump since March, following OPEC+ decision to lower output quota by 2 million barrels per day in November
-
Real impact of this decision will however be limited - output cut would amount to no more than 0.8-1.0 million barrels, assuming that countries that are currently underproducing will not increase their production
-
It should be noted that should all OPEC+ countries produce in-line with new quota, combined output of the group would be higher than now
-
Profit taking that took place at the beginning of this week can be reasoned with concerns over global economic conditions, which are further exacerbated by Fed's tightening
-
Nevertheless, it should be also noted that oil stockpiles, especially in the United States, sit at extremely low levels
-
According to OPEC and other institutions, the oil market has disconnected from fundamentals. This disconnect can be attributed uncertainty over future US decision as well as decision of OPEC and is evidence in low open interest on the oil market
 OPEC+ output stood at less than 39 million barrels per day in September. Output goal for November was set at slightly above 40 million barrels. Output cuts by countries like Saudi Arabia, UAE or Iraq may amount to 0.8-1.0 million barrels. On the other hand, should all countries comply with November's quota, production would increase compared to now. Morgan Stanley points out that implied output cut amount to less than 0.8 million barrels per day. Source: Morgan Stanley
Start investing today or test a free demo
Open real account TRY DEMO Download mobile app Download mobile app Correlation between WTI prices and US oil inventories has been quite strong since the Global Financial Crisis.A significant divergence can be spotted now. This is the second such divergence in the past 10 years (previous one was in 2017-2018), that points to higher oil prices. However, it should be noted that a drop in SPR led to stabilization in commercial stockpiles. Should demand remain unchanged and reserves are not depleted further, oil inventories may drop significantly in the final month of the year. Source: Bloomberg
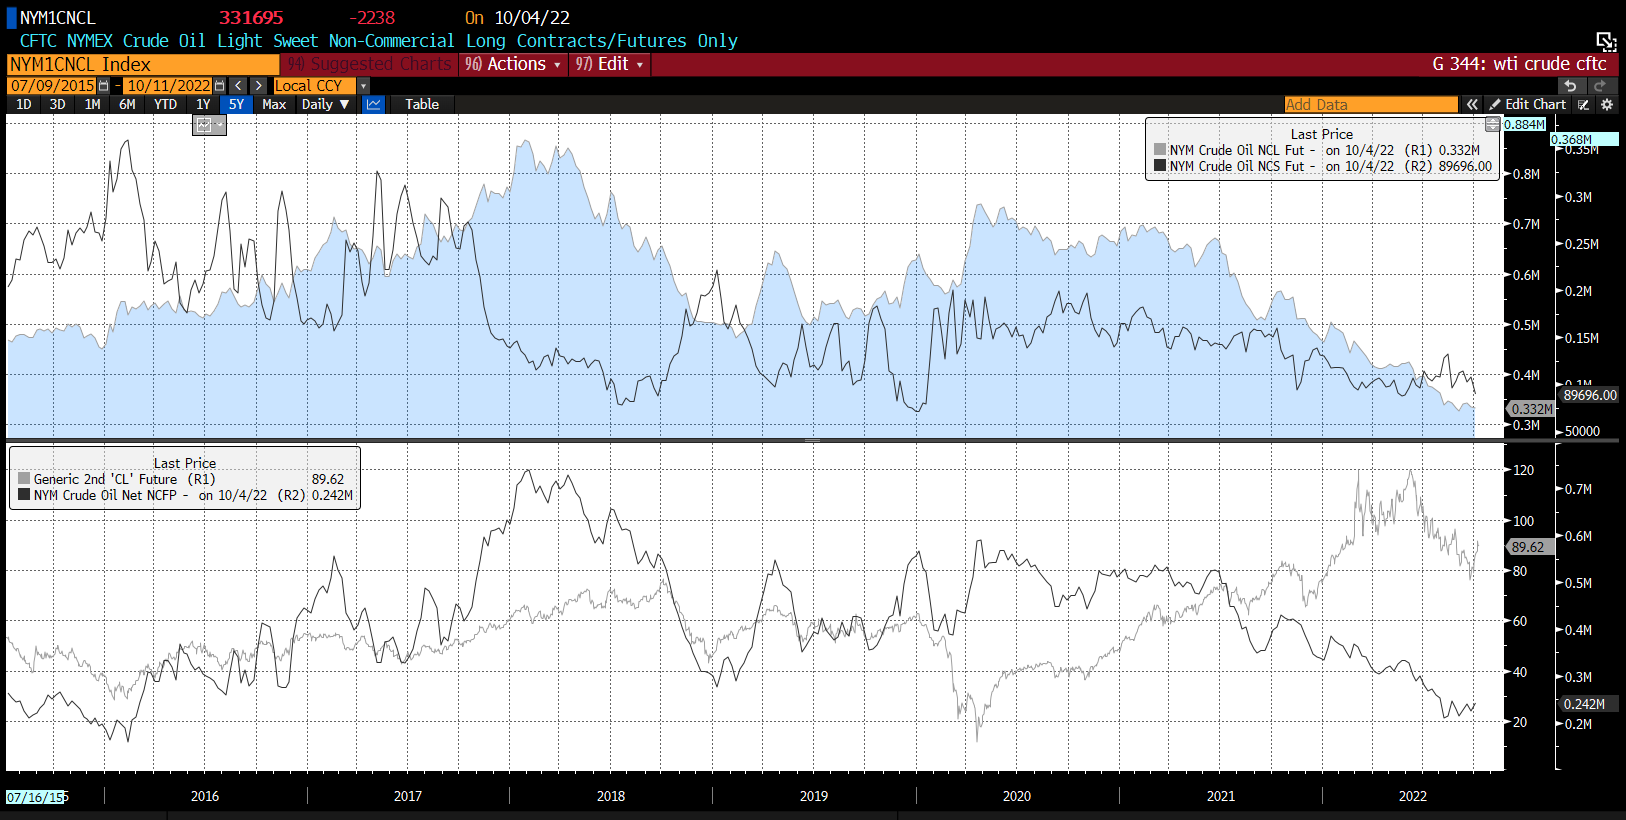 There is low interest of speculators in the oil market given huge uncertainty related to US and OPEC+ actions. One should remember that US authorities have been trying to bring down oil prices for almost a year now in order to achieve political gains. There will be no such need after midterm elections scheduled for November so one could expect investor to return to oil markets by the end of the year. Source: Bloomberg
Copper
-
Copper prices tried to resume uptrend in recent months but those attempts were quickly suppressed
-
A weakening of the US dollar would be needed for uptrend on copper to resume
-
Moreover, we are not only seeing a strong USD but also a very weak Chinese yuan, pointing to a rather lackluster condition of the Chinese economy
-
More than 50% of global copper demand comes from China therefore a weakness on this market cannot be ruled out in near-term
-
Additionally, Chinese credit impulse shows there is no demand pressure on copper
-
Pick-up in energy transformation trend would support copper demand but this is a rather long-term scenario
-
It should be noted that copper stockpiles on exchanges remain low. Similar situation occurred in 2014 - stockpiles were low but prices still saw significant declines
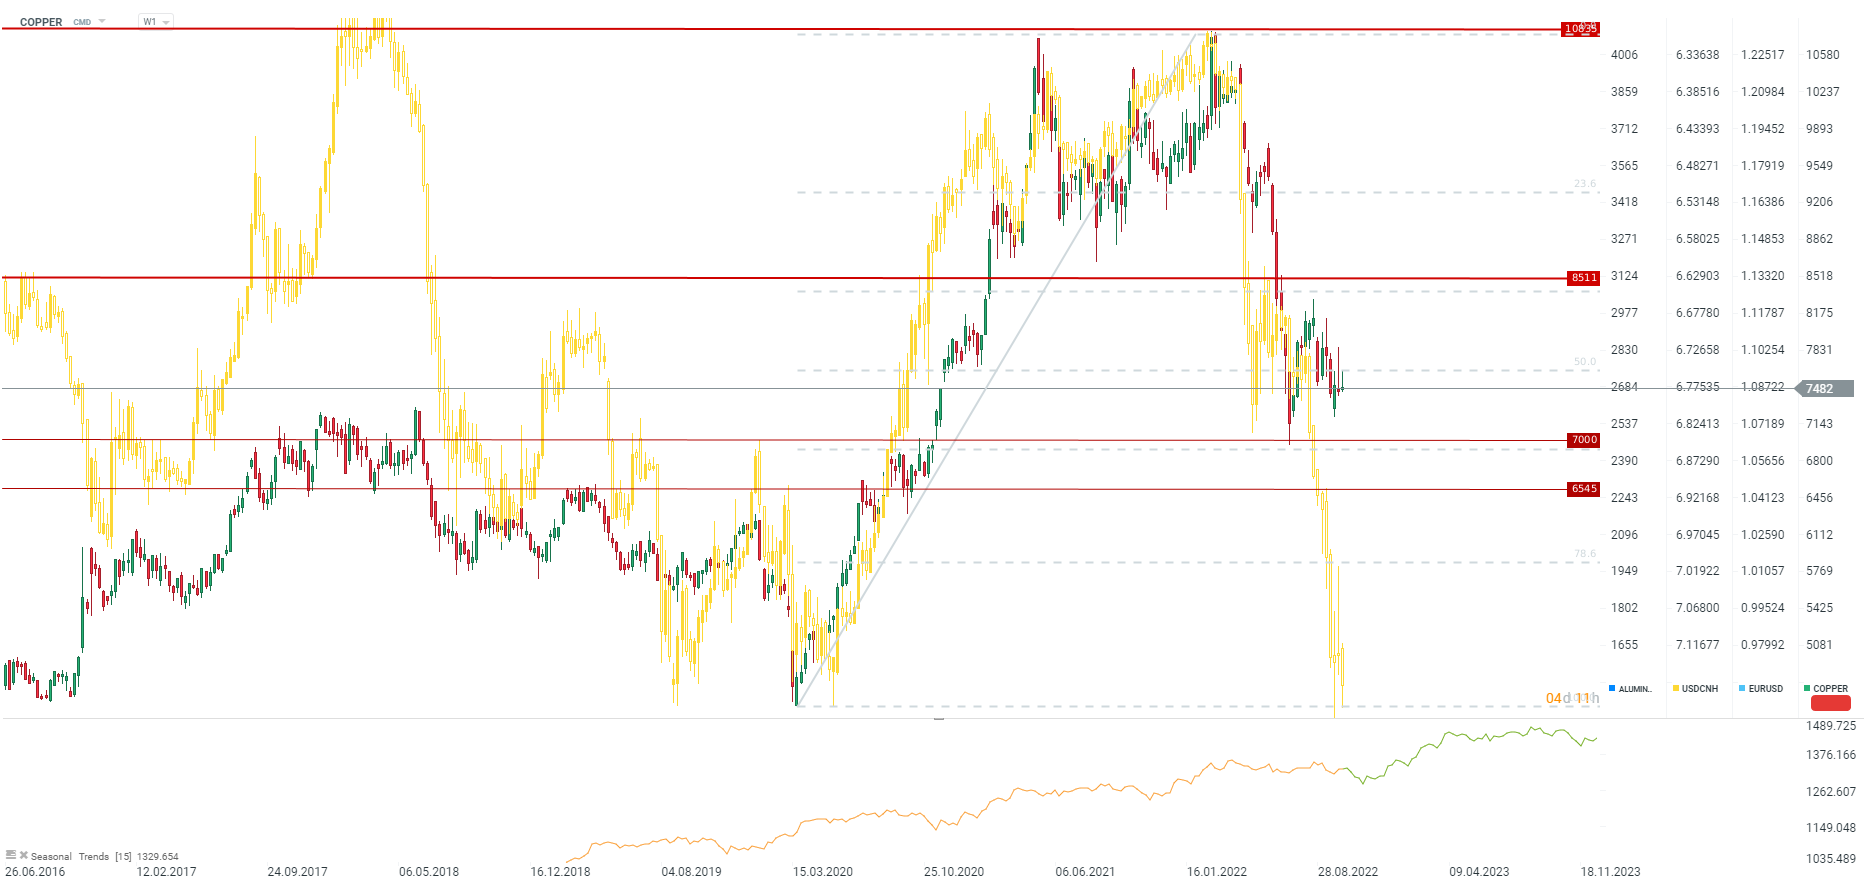 Weak CNY paints a bleak picture for copper going forward. Source: xStation5
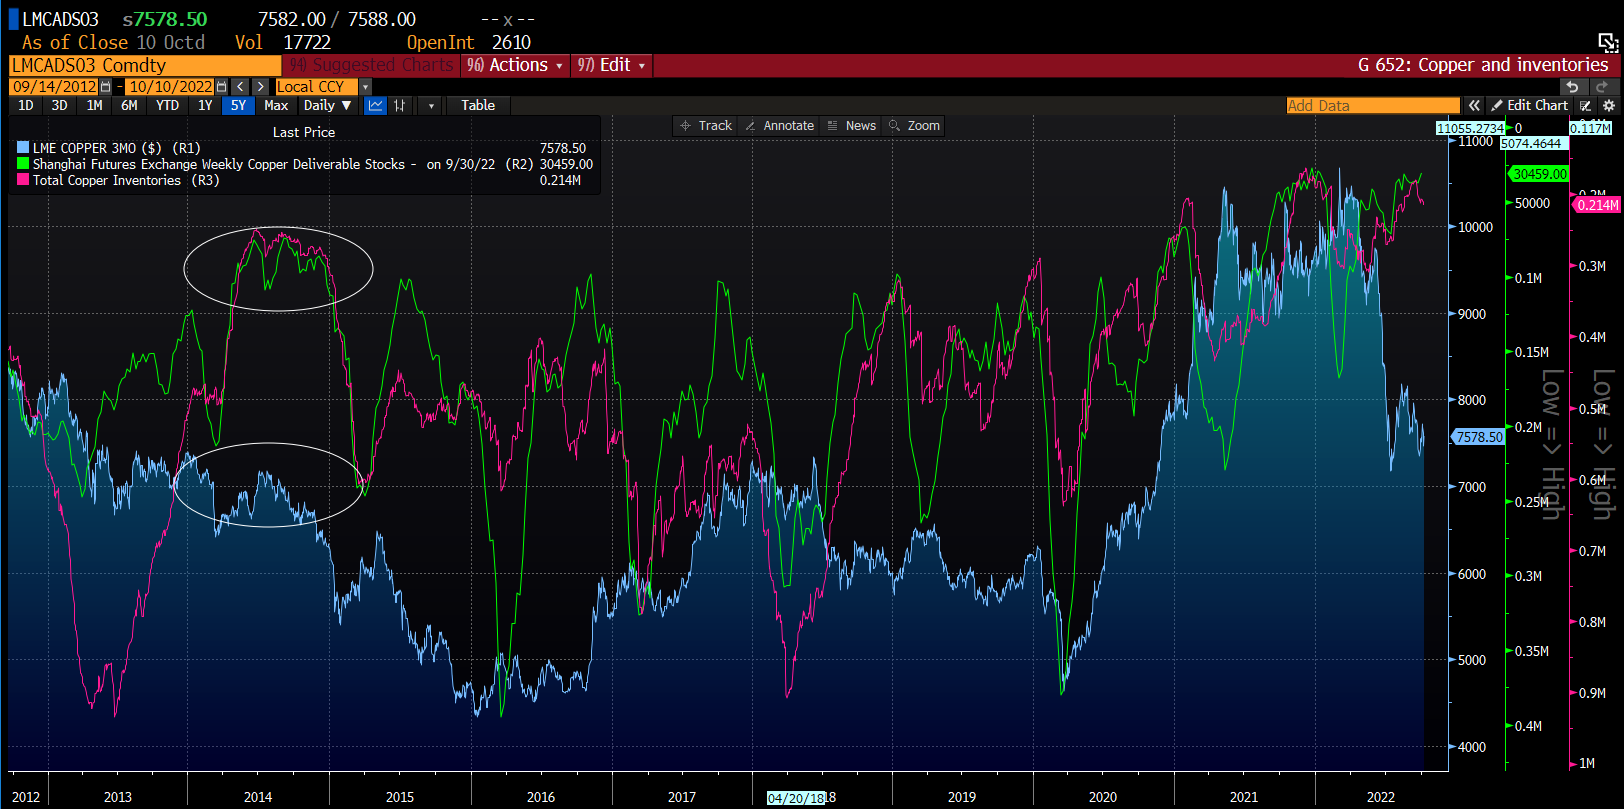 Copper stockpiles in 2014 were very low but it did not stop prices from falling significantly. Similar situation could be playing out now. Source: Bloomberg
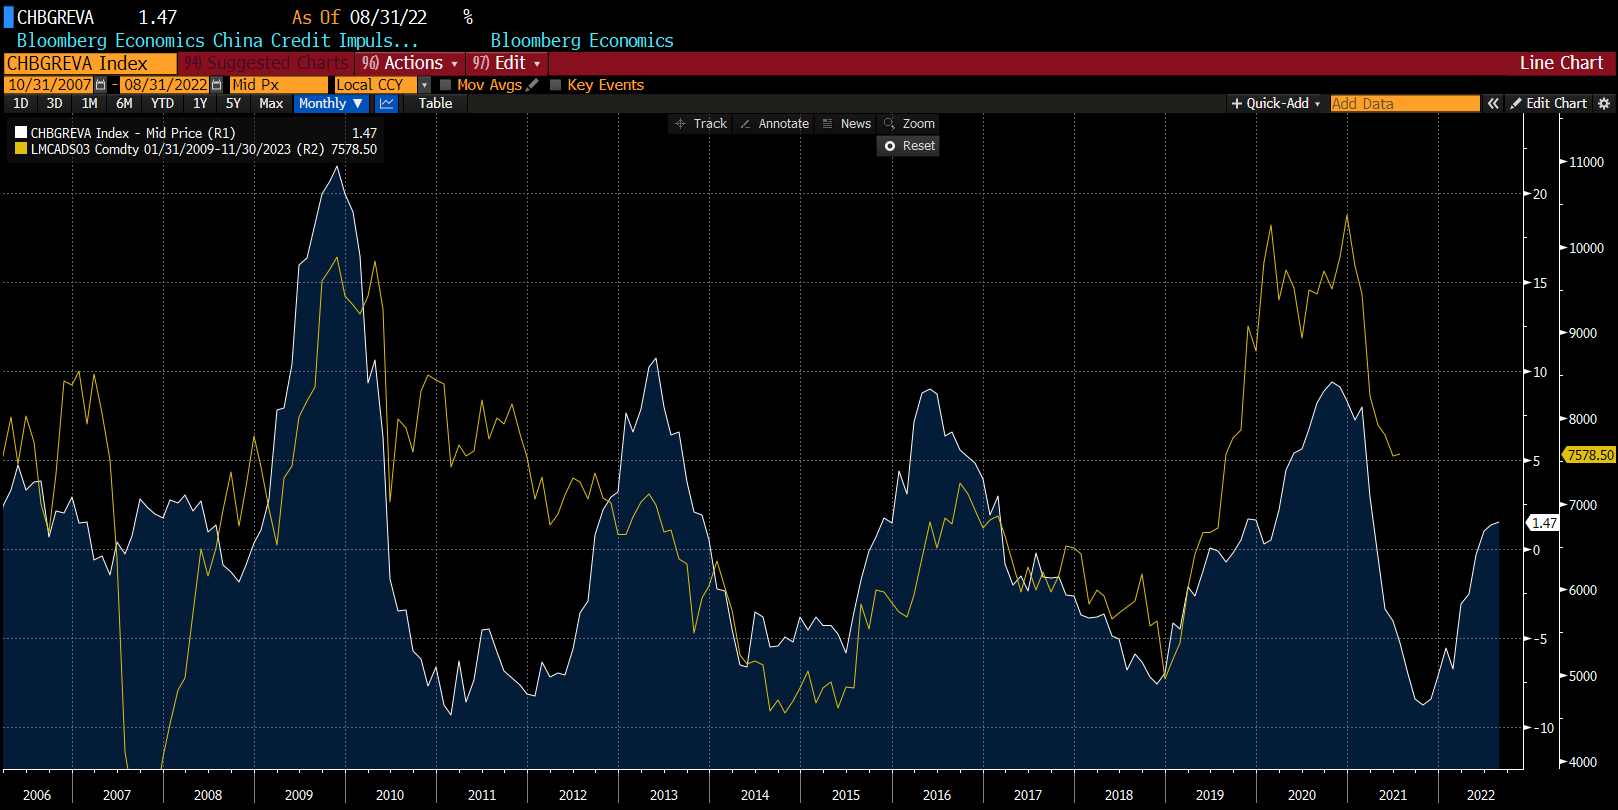 There is a noticeable correlation between Chinese credit impulse (12-18 months lead) and copper prices. We can see that downward pressure on prices may remain but the turn of this and the next year may see a recovery in demand in China. Source: Bloomberg
Gold
-
USD rally of 1995-2001 led to an almost 40% drop in gold prices
-
Current USD strengthening is of similar scale as it was in 1995-2001. Assuming similar gold price drop, price of the precious metal may drop to as low as $1,250 per ounce
-
Simultaneously, one should not forget that interest rate hikes in the United States should halt or at least slow by the end of this year. This suggests that year's end period may be a turning point for gold
-
Strong USD and investors' reluctance towards equity markets, that leads to lower interest in ETFs, can be seen among the biggest headwinds for gold
-
Should weaked sentiment remain, a key spot to look for gold investors is $1,500 area, where the long-term trendline runs and a range of 2012-2013 corrections can be found
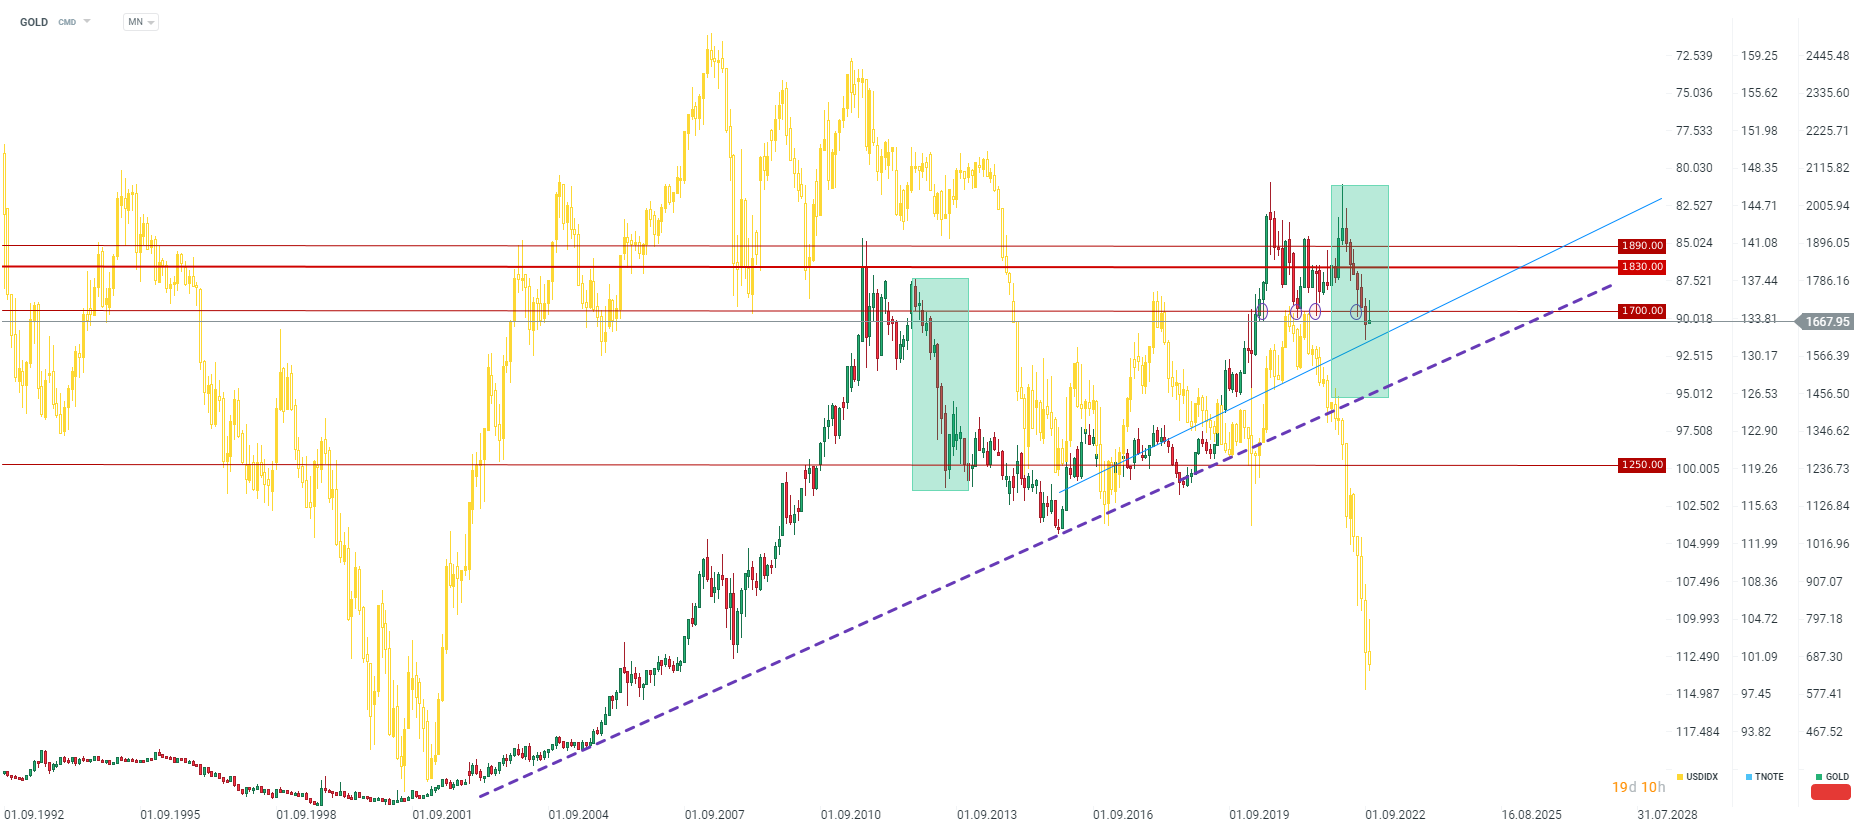 USD dollar rally that took place at the end of previous millenia led to an around 40% drop in gold prices. Unless we see a change in the situation on US dollar market, gold may see a deeper sell-off, with $1,500 and $1,250 being key levels to watch. Source: xStation5
Iron Ore - AUDUSD
-
Poor outlook for global and Chinese economies lead to a pullback on iron ore market
-
This could also be a bad signal for other base metals, like copper, aluminum or zinc
-
Australia is the biggest producer of iron ore in the world therefore dropping iron ore prices may have a significant negative impact on Australian economy
-
Moreover, Australia economy experienced the first drop in consumer spending in months
-
Change in RBA approach and limiting rate hikes may also have a negative impact on the future performance of Aussie
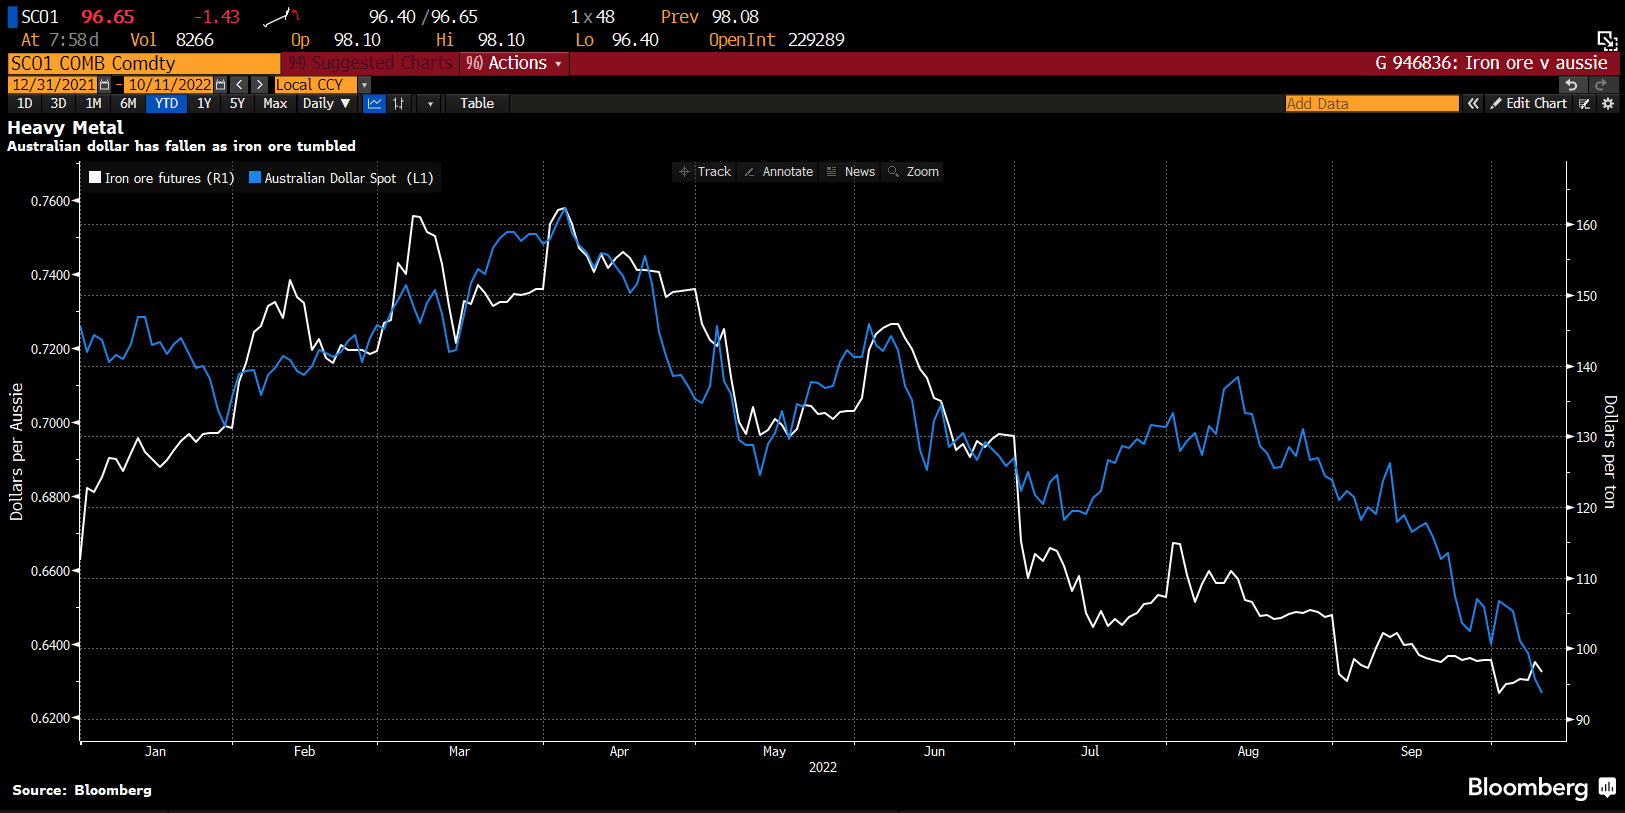 Correlation between the price of iron ore and AUDUSD is getting more and more significant. Source: Bloomberg
