Oil:
- Brent is trading above $ 60 a barrel. January 2020 highs are located around $ 70 a barrel
- Huge amount of call options is located around $ 60 a barrel. Currently the number of call options in this area accounts for approximately 150,000 contracts, while a year ago it was only 100 000. The ratio of call options to put options is the highest since mid-2019
- Despite the fact that the world is shifting towards renewable energy and electric transport, CAPEX in the oil and gas sector is highest since 2014. Saudi Arabia is increasing production capacity up to 13 mb / d, and the UAE up to 5 mb / d
- Some analysts' expert that oil price will reach f $ 100 a barrel. On the other hand, one should remember about huge supply that is currently dormant, while demand is still limited
- Despite the fact that OPEC + increased production in January, the total production of the group remains within the limits, mainly thanks to Saudi Arabia, Iran and Venezuela
- OPEC + does not want to increase production in February or March. Nevertheless, the currently high prices may lead to a single large production increase after March or April (1.5-2.0 mb / d)
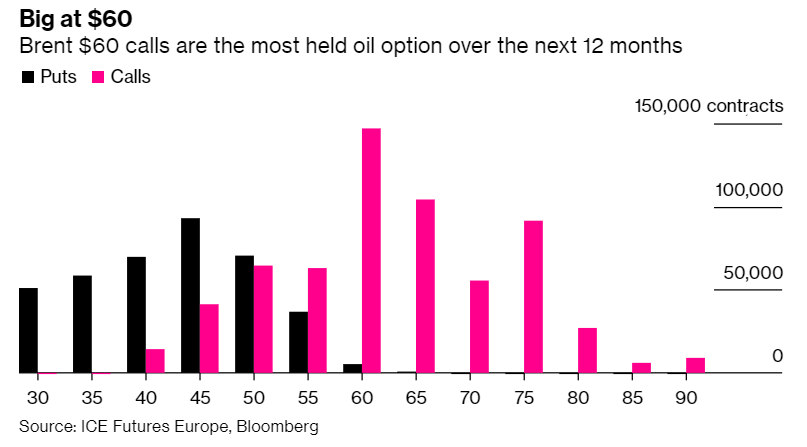 The number of call options around $ 60 per barrel is excessively high. Source: Bloomberg
Kezdjen befektetni még ma, vagy próbálja ki ingyenes demónkat
Élő számla regisztráció DEMÓ SZÁMLA Mobil app letöltése Mobil app letöltése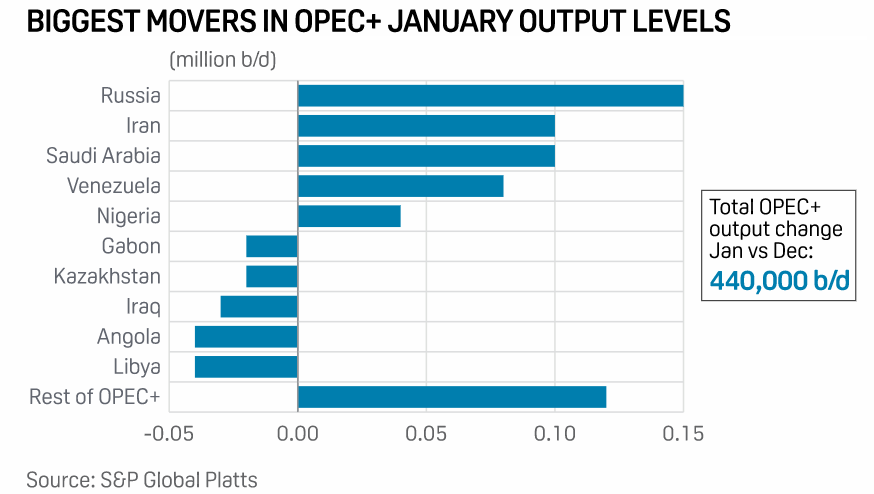 Production increased significantly in January, but is now being further constrained by Saudi Arabia. Source: S&P Platts
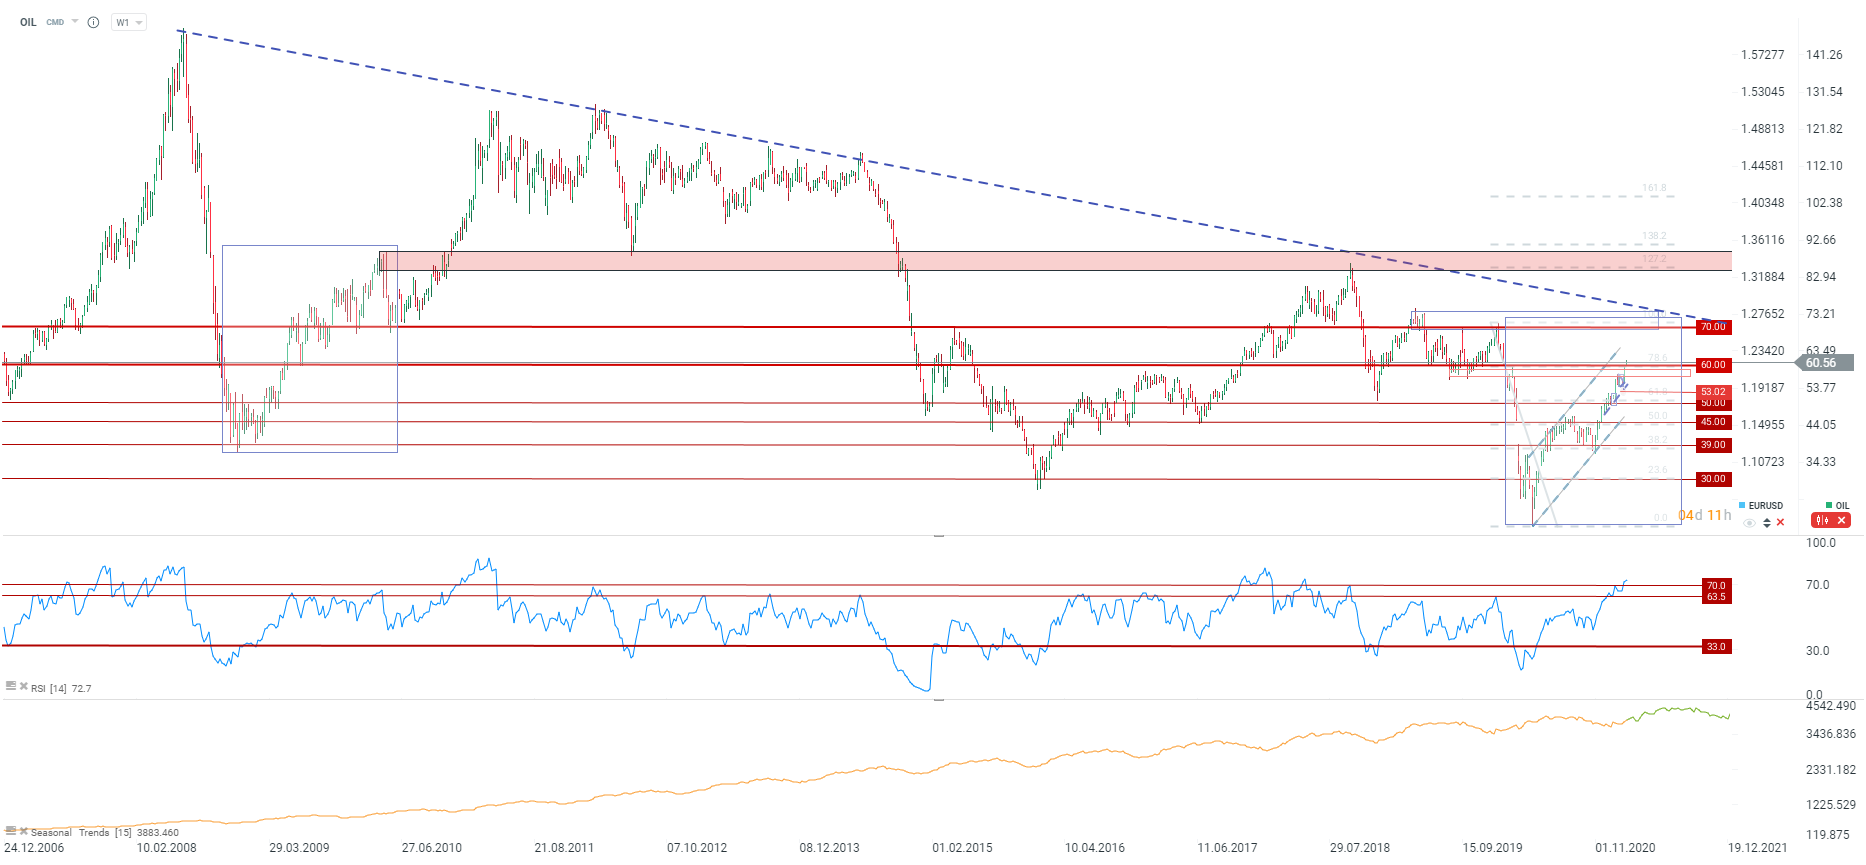 Crude oil broke through a very important supply zone around $ 60 a barrel. As one can see, this is a key zone for investors from the options market. Therefore, there is a potential for a downward correction or acceleration of the upward move from this level. In the second scenario, the target is located around $ 70 per barrel and coincides with the long-term downward trendline. Source: xStation5
Natural gas:
- The price of gas has risen again due to weather factors, both worldwide and especially in North America
- There is speculation that prices will return to $ 3 for MMBTU
- The volume and open interest show a rebound in the gas market, which wass not very common this year, as indicated by the seasonality
- The seasonality indicates that price will be moving in sideways trend within the next 3 months, similar to a year ago
- Gas inventories behave in line with the seasonality, however we are entering a period during which inventories levels may fluctuate
- LNG gas exports already surpass U.S. gas exports via pipelines, indicating that the fundamental factors may change in the future
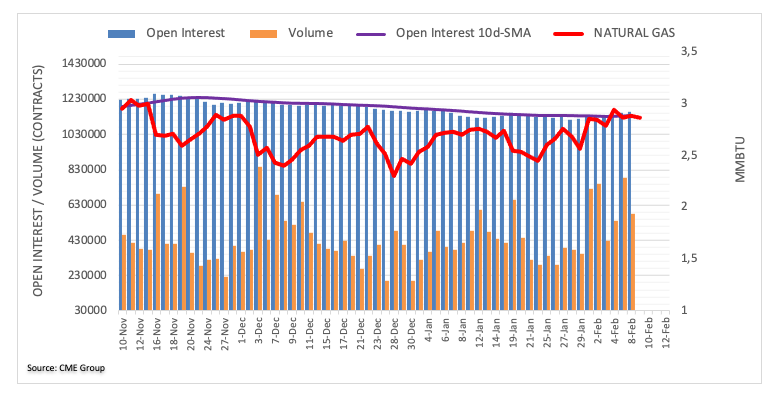 Volume and open interest are both rising, which means an increase in investor interest. Source: CME
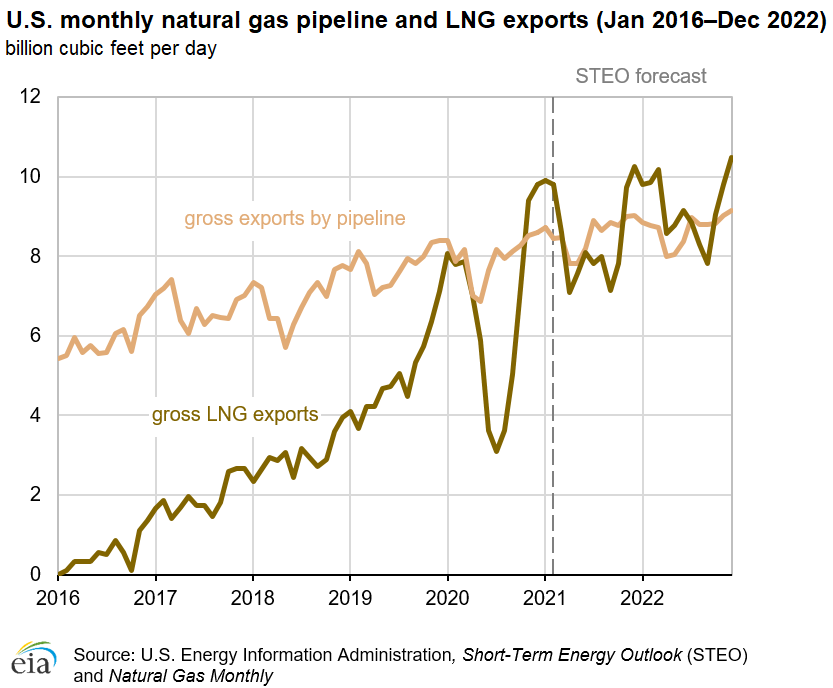 LNG gas exports surpassed gas exports via traditional transmission methods, which means changing long-term fundamental factors. Source: EIA
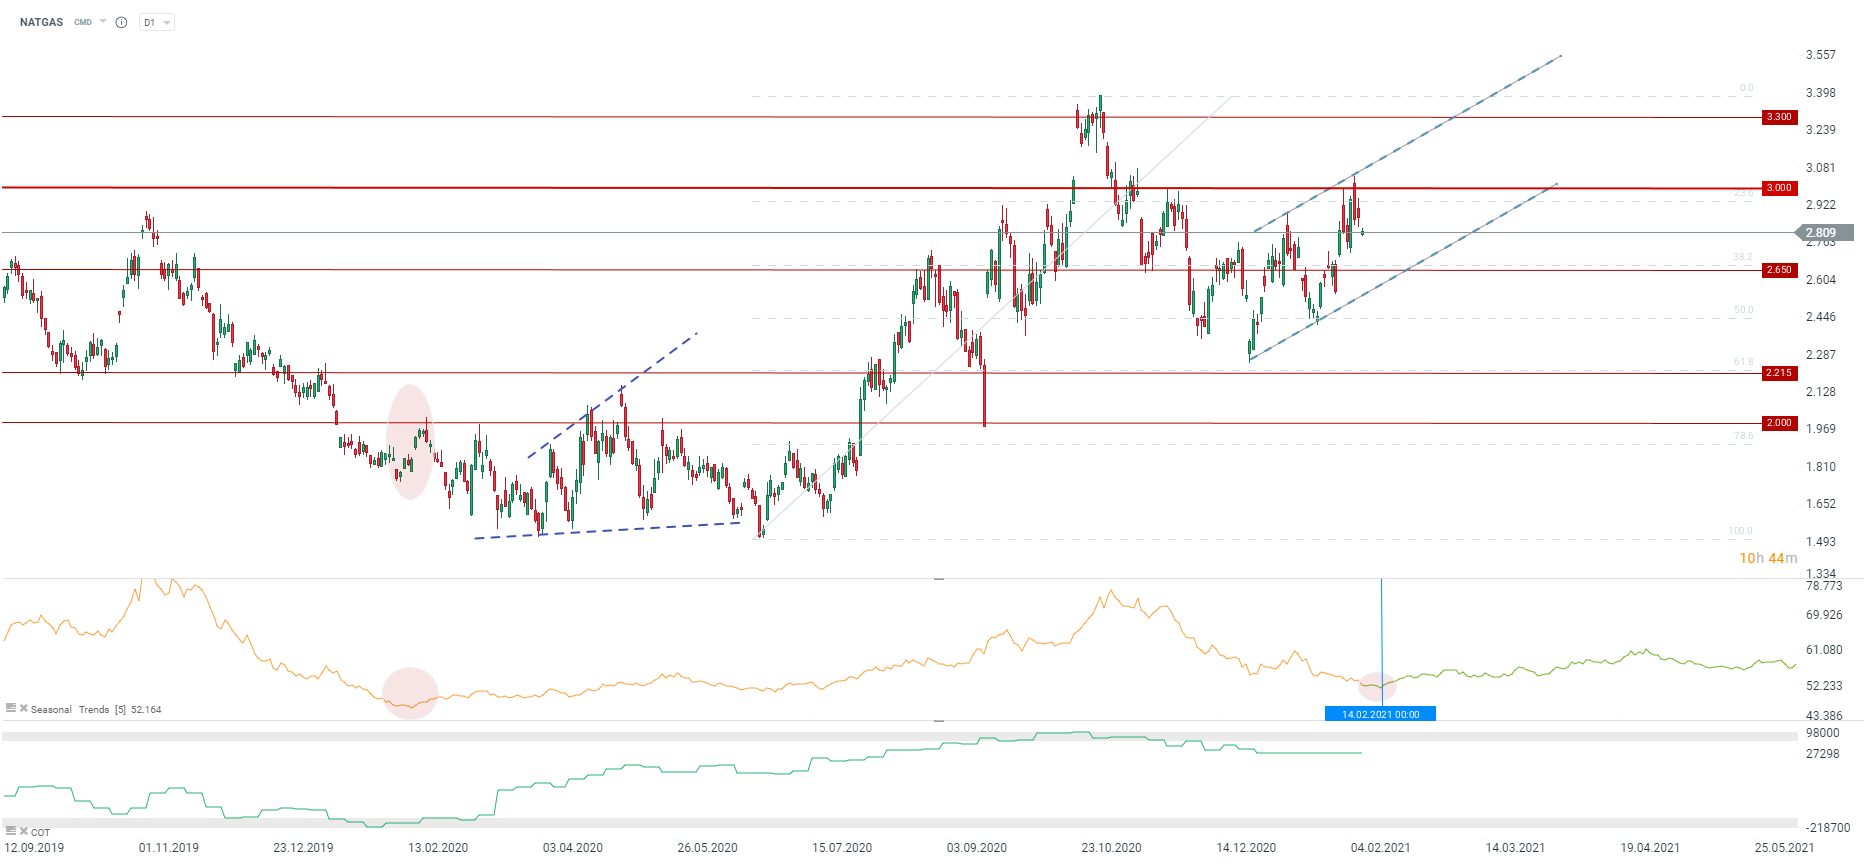 The price dropped to 3.00 MMBTU. Based on a similar price behavior as last year, the hard bottom should be located around USD 2.5 MMBTU. However, if the low temperatures persist, then this may affect the inventories level, which may lead to slightly higher prices. On the other hand, from May one should expect prices to stabilize at lower levels. Source: xStation5
Platinum:
- According to UBS, this year we will see a very strong increase in investment demand for platinum
- Since the end of last year, ETFs have clearly been buying up platinum, which of course led to a significant rebound in the price of this metal.
- Currently, the price is testing the resistance around USD 1190 per ounce - a local peak from 2016. Should a break above occur, then price may be heading towards 2015 highs
- Another resistance zone is located around $ 1,300 an ounce
- The director of the World Platinum Investment Council indicates that the substitution of palladium with platinum in gasoline engine catalysts is already taking place.
- The lack of public information is the result of a very competitive market
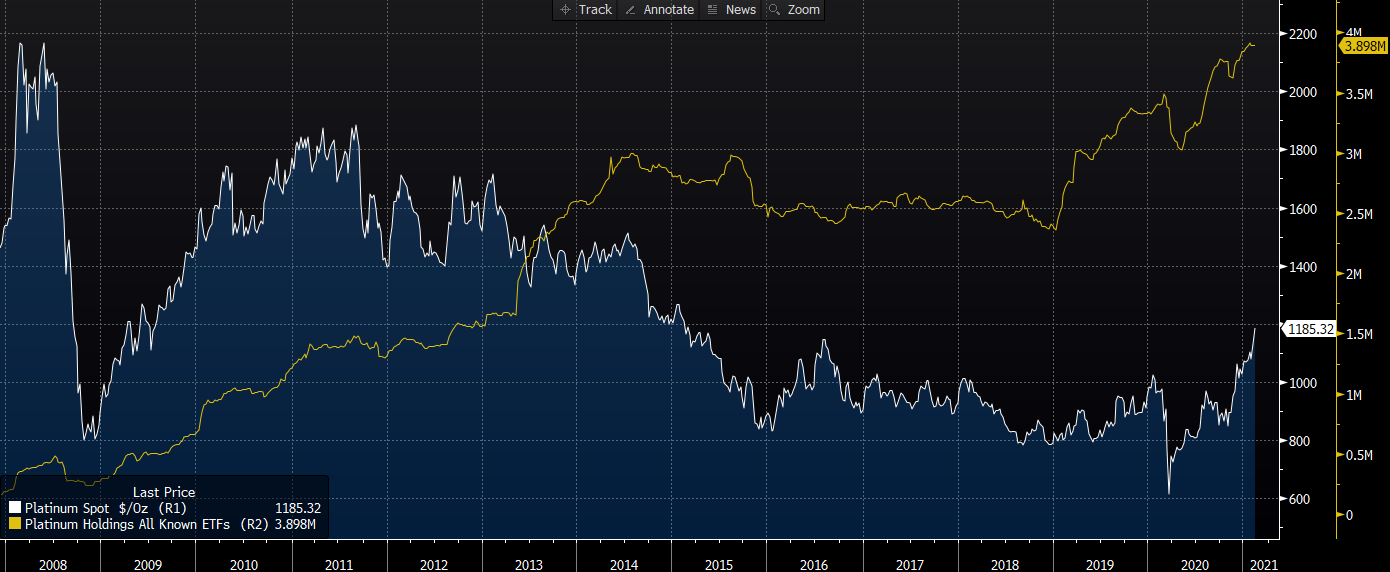 ETFs were buying platinum heavily last year. Due to the fact that this metal is still relatively cheap, it may provide an opportunity for investors, especially in times of rising inflation. Source: Bloomberg
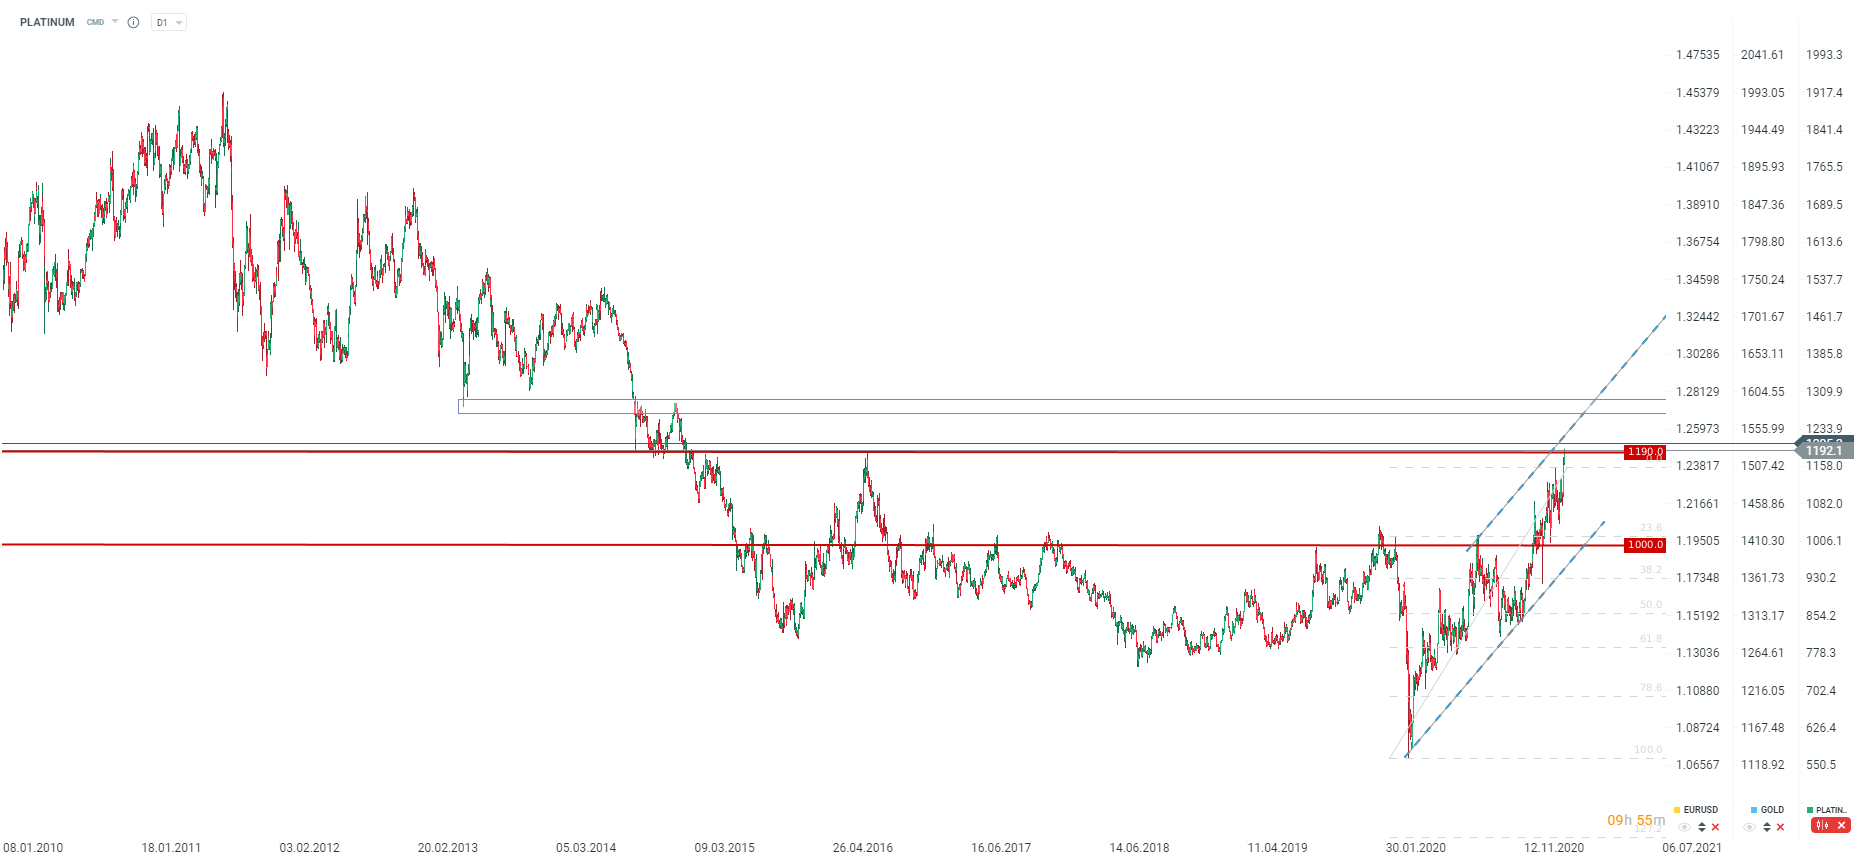 The price is testing around $ 1190 an ounce. Since the low point in March, the price has already increased over 100%. The same applies to the silver market. Still, these metals have a lot of room for growth compared to more expensive assets. Source: xStation5
Corn:
- Corn is halfway from its historic peaks, testing a 50.0% retracement of the entire downward move that lasted from 2012 to 2020
- Seasonality points to potential gains through March, while on the other hand, positioning remains at its all-time highs
- Higher prices are the related to increased demand from China
- Due to the high demand from China, the price target is located at 600 cents a bushel. However due to the drought in South Africa, there may be a shortage of corn on the market, which could push the price towards 700 cents a bushel
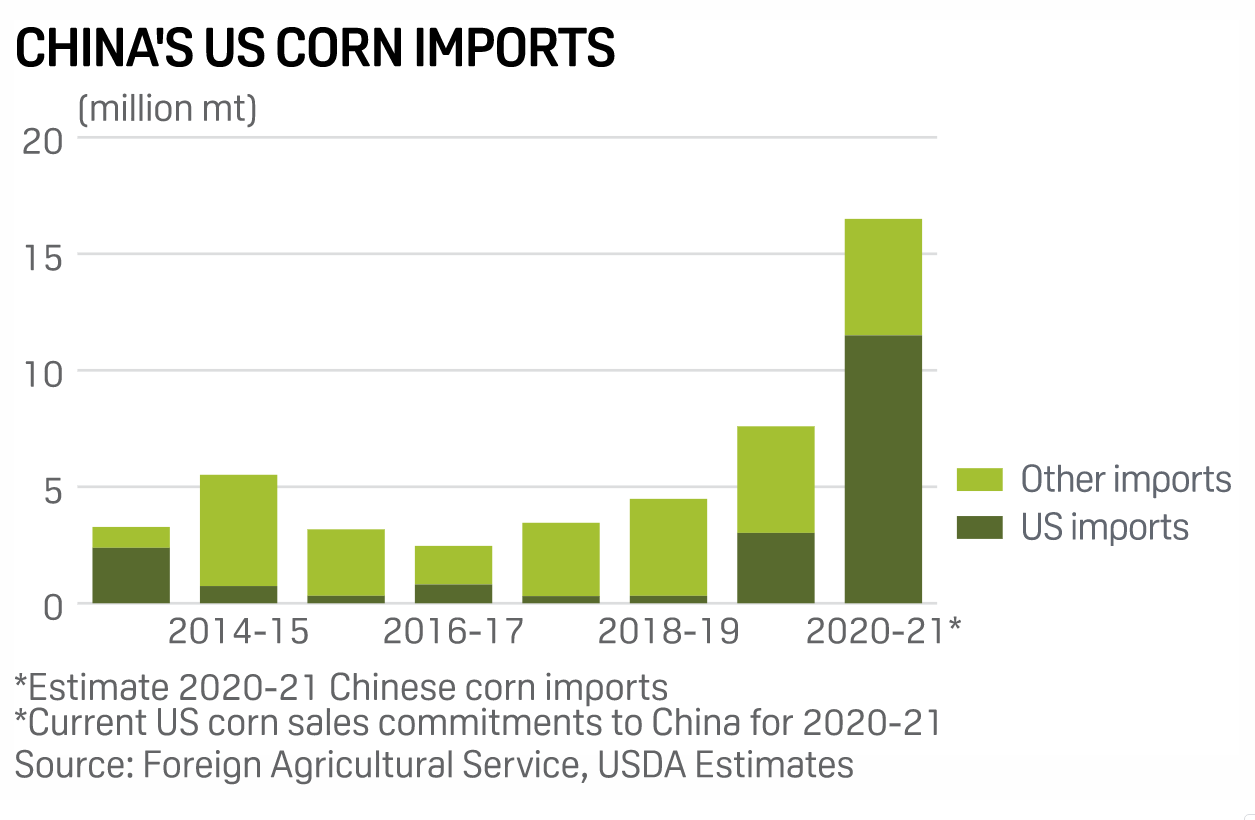 Imports in the current season may be several hundred percent higher than in the previous years, which will "drain" US corn inventories. Source: FAS, USDA
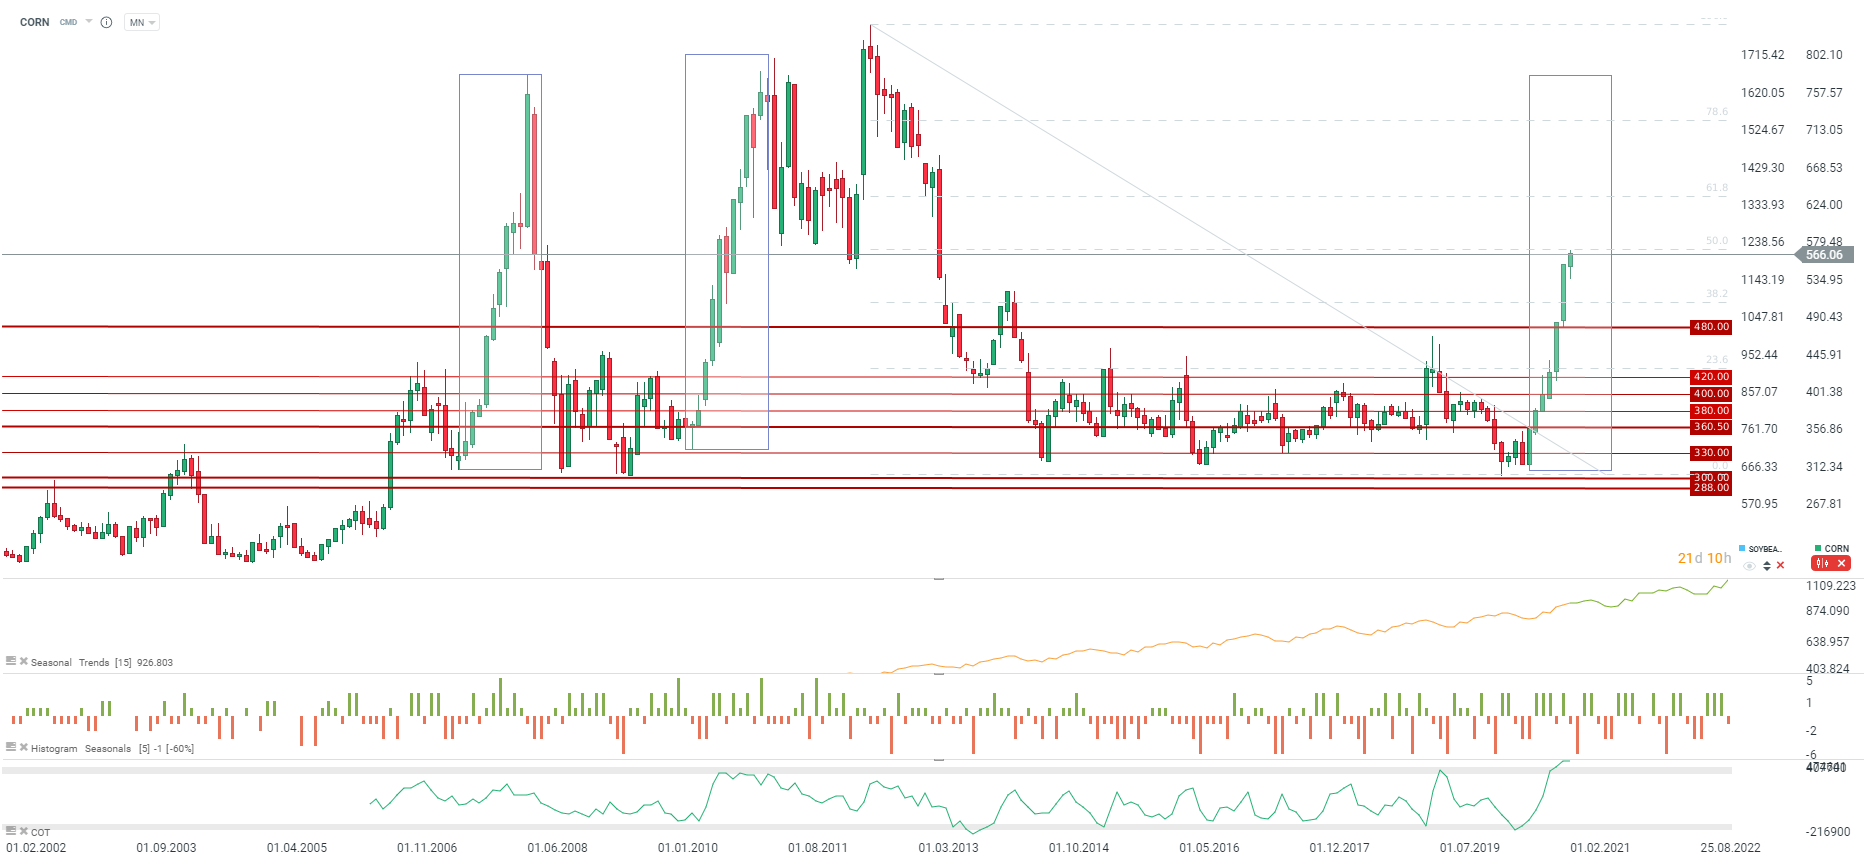 We may witness a similar situation to the one from 2007-2008 and 2010-2011. The fundamental situation seems to support the buyers, while the term structure shows a huge backwardation. Source: xStation5
Ezen tartalmat az XTB S.A. készítette, amelynek székhelye Varsóban található a következő címen, Prosta 67, 00-838 Varsó, Lengyelország (KRS szám: 0000217580), és a lengyel pénzügyi hatóság (KNF) felügyeli (sz. DDM-M-4021-57-1/2005). Ezen tartalom a 2014/65/EU irányelvének, ami az Európai Parlament és a Tanács 2014. május 15-i határozata a pénzügyi eszközök piacairól , 24. cikkének (3) bekezdése , valamint a 2002/92 / EK irányelv és a 2011/61 / EU irányelv (MiFID II) szerint marketingkommunikációnak minősül, továbbá nem minősül befektetési tanácsadásnak vagy befektetési kutatásnak. A marketingkommunikáció nem befektetési ajánlás vagy információ, amely befektetési stratégiát javasol a következő rendeleteknek megfelelően, Az Európai Parlament és a Tanács 596/2014 / EU rendelete (2014. április 16.) a piaci visszaélésekről (a piaci visszaélésekről szóló rendelet), valamint a 2003/6 / EK európai parlamenti és tanácsi irányelv és a 2003/124 / EK bizottsági irányelvek hatályon kívül helyezéséről / EK, 2003/125 / EK és 2004/72 / EK, valamint az (EU) 2016/958 bizottsági felhatalmazáson alapuló rendelet (2016. március 9.) az 596/2014 / EU európai parlamenti és tanácsi rendeletnek a szabályozási technikai szabályozás tekintetében történő kiegészítéséről a befektetési ajánlások vagy a befektetési stratégiát javasló vagy javasló egyéb információk objektív bemutatására, valamint az egyes érdekek vagy összeférhetetlenség utáni jelek nyilvánosságra hozatalának technikai szabályaira vonatkozó szabványok vagy egyéb tanácsadás, ideértve a befektetési tanácsadást is, az A pénzügyi eszközök kereskedelméről szóló, 2005. július 29-i törvény (azaz a 2019. évi Lap, módosított 875 tétel). Ezen marketingkommunikáció a legnagyobb gondossággal, tárgyilagossággal készült, bemutatja azokat a tényeket, amelyek a szerző számára a készítés időpontjában ismertek voltak , valamint mindenféle értékelési elemtől mentes. A marketingkommunikáció az Ügyfél igényeinek, az egyéni pénzügyi helyzetének figyelembevétele nélkül készül, és semmilyen módon nem terjeszt elő befektetési stratégiát. A marketingkommunikáció nem minősül semmilyen pénzügyi eszköz eladási, felajánlási, feliratkozási, vásárlási felhívásának, hirdetésének vagy promóciójának. Az XTB S.A. nem vállal felelősséget az Ügyfél ezen marketingkommunikációban foglalt információk alapján tett cselekedeteiért vagy mulasztásaiért, különösen a pénzügyi eszközök megszerzéséért vagy elidegenítéséért. Abban az esetben, ha a marketingkommunikáció bármilyen információt tartalmaz az abban megjelölt pénzügyi eszközökkel kapcsolatos eredményekről, azok nem jelentenek garanciát vagy előrejelzést a jövőbeli eredményekkel kapcsolatban.