Investors were offered the first Q4 earnings reports from US banks today before the opening of the Wall Street cash session. Among today's earnings reporters one could find BlackRock, Wells Fargo, JPMorgan and Citigroup. Highlights from each report have been listed below.
BlackRock (BLK.US)
- Revenue: $4.63 billion vs $4.63 billion expected (+6.8% YoY)
- Investment advisory performance fees: $311 million vs $219.3 million expected (+36% YoY)
- Base fees and securities lending: $3.61 billion vs $3.64 billion expected (+6.1% YoY)
- Technology services: $379 million vs $391 million expected (+7.4% YoY)
- Net inflows: $95.65 billion vs $128.37 billion expected
- Long-term: $62.70 billion vs $96.85 billion expected
- Equity: $34.09 billion vs $39.15 billion expected
- Fixed Income: 32.18 billion vs $35.48 billion expected
- Institutional: -$16.07 billion
- Retail: -$8.96 billion
- Adjusted EPS: $9.66 vs $8.88 expected ($8.93 a year ago)
- Assets under management: $10.01 trillion vs $9.78 trillion expected (+16% YoY)
- Operating Margin: 34.2% vs 34.9% expected (32.9% a year ago)
- Total expenses: $3.05 billion vs $3.01 billion expected (+4.7% YoY)
- Approves 2% increase in quarterly dividend to $5.10 per share
- Agrees to buy Global Infrastructure Partners for $12.5 billion
 BlackRock (BLK.US) trades more or less flat in pre-market today, after reporting better-than-expected earnings and in-line revenue. Stock has recently experienced a downward correction and retested the $775 price zone. Source: xStation5
Wells Fargo (WFC.US)
- Revenue: $20.48 billion vs $20.35 billion expected
- Commercial banking: $3.37 billion vs $3.29 billion expected
- Corporate and investment banking: $4.74 billion vs $4.32 billion expected
- Wealth & investment management: $3.66 billion vs $3.64 billion expected
- Net interest income: $12.77 billion vs $12.77 billion expected
- EPS: $0.86
- Total average loans: $938 billion vs $942 billion expected
- Total average deposits
- Efficiency ratio: 77% vs 67% expected
- Net interest margin: 2.92% vs 2.95% expected
- Return on equity: 7.6% vs 8.6% expected
- Common equity Tier 1 ratio: 11.4% vs 10.9% expected
- Provision for credit losses: $1.28 billion vs $1.32 billion expected
- Expects 2024 net interest income to be potentially 7-9% YoY low
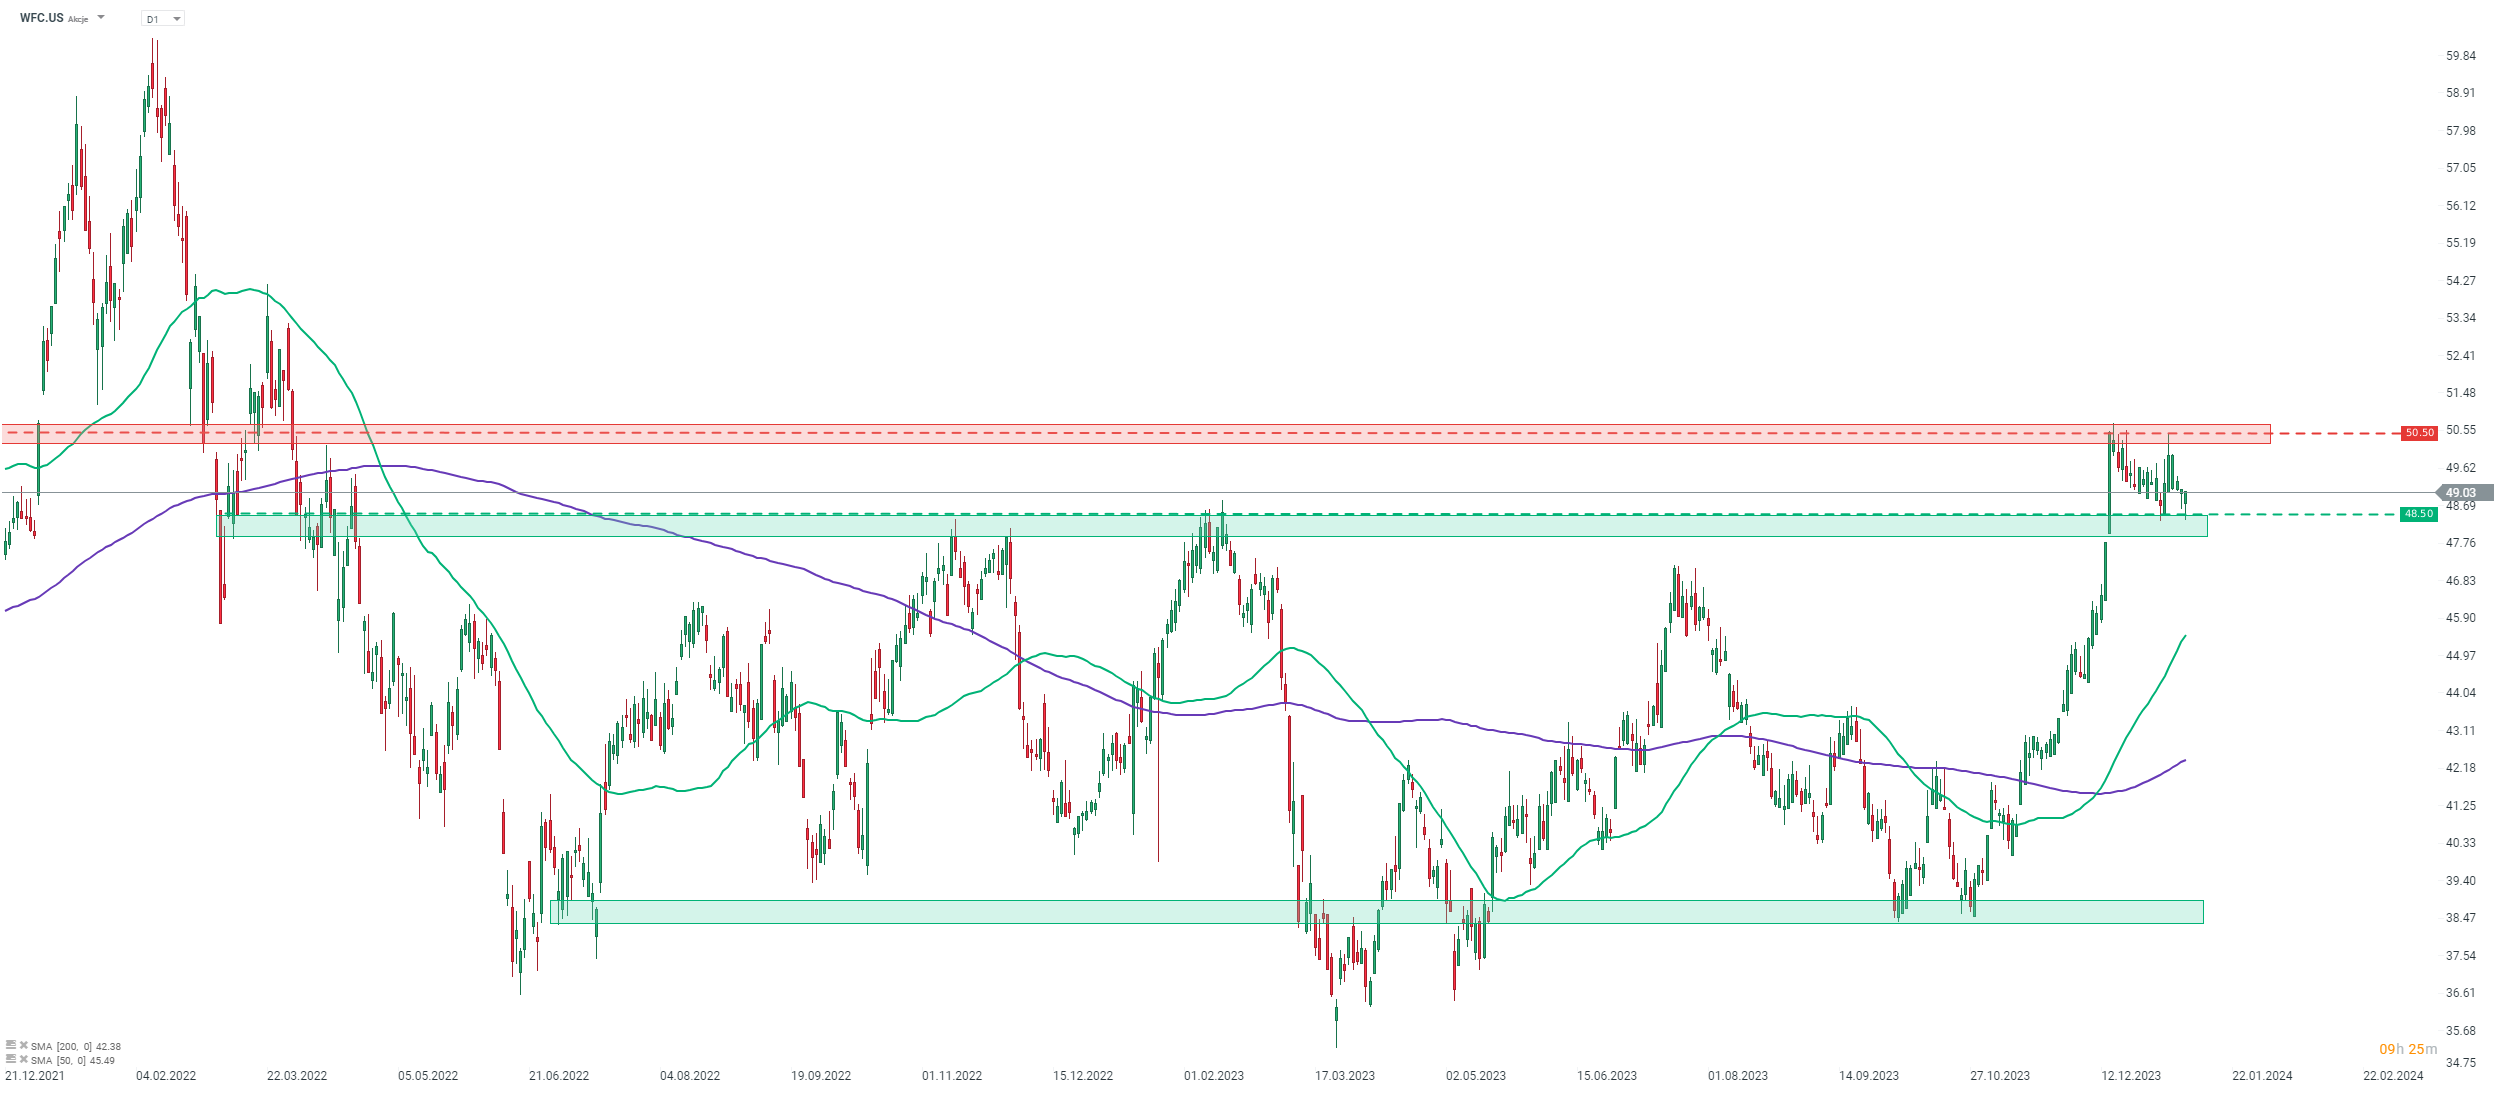
 Wells Fargo (WFC.US) trades slightly lower in pre-market in spite of a beat in Q4 sales. Stock has broken above the upper limit of trading range at $48.50 recently but has struggled to maintain bullish momentum since. Source: xStation5
JPMorgan (JPM.US)
- Adjusted revenue: $39.94 billion vs $40.23 billion expected (+12% YoY)
- Fixed income trading: $4.03 billion vs $3.84 billion expected (+7.9% YoY)
- Equity trading: $1.78 billion vs $1.93 billion expected (-7.9% YoY)
- Investment banking: $1.58 billion vs $1.72 billion expected (+13% YoY)
- CIB Markets: $5.81 billion vs $5.77 billion expected (+2.5% YoY)
- EPS: $3.04 ($3.57 a year ago)
- Loans: $1.32 trillion vs $1.32 trillion expected (+17% YoY)
- Deposits: $2.40 trillion vs $2.36 trillion expected
- Provision for credit losses: $2.76 billion vs $2.42 billion expected (+21% YoY)
- Net charge-offs: $2.16 billion vs $1.9 billion expected
- Managed net interest income: $24.18 billion vs $23.01 billion expected (+19% YoY)
- Standardized Common Equity Tier 1 ratio: 15% vs 14.3% expected
- Return on equity: 12% vs 13.8% expected
- Assets under management: $3.42 trillion vs $3.32 trillion expected
- Expects full-year net interest income at around $90 billion (exp. $86.1 billion)
- Expects full-year adjusted expenses at around $90 billion
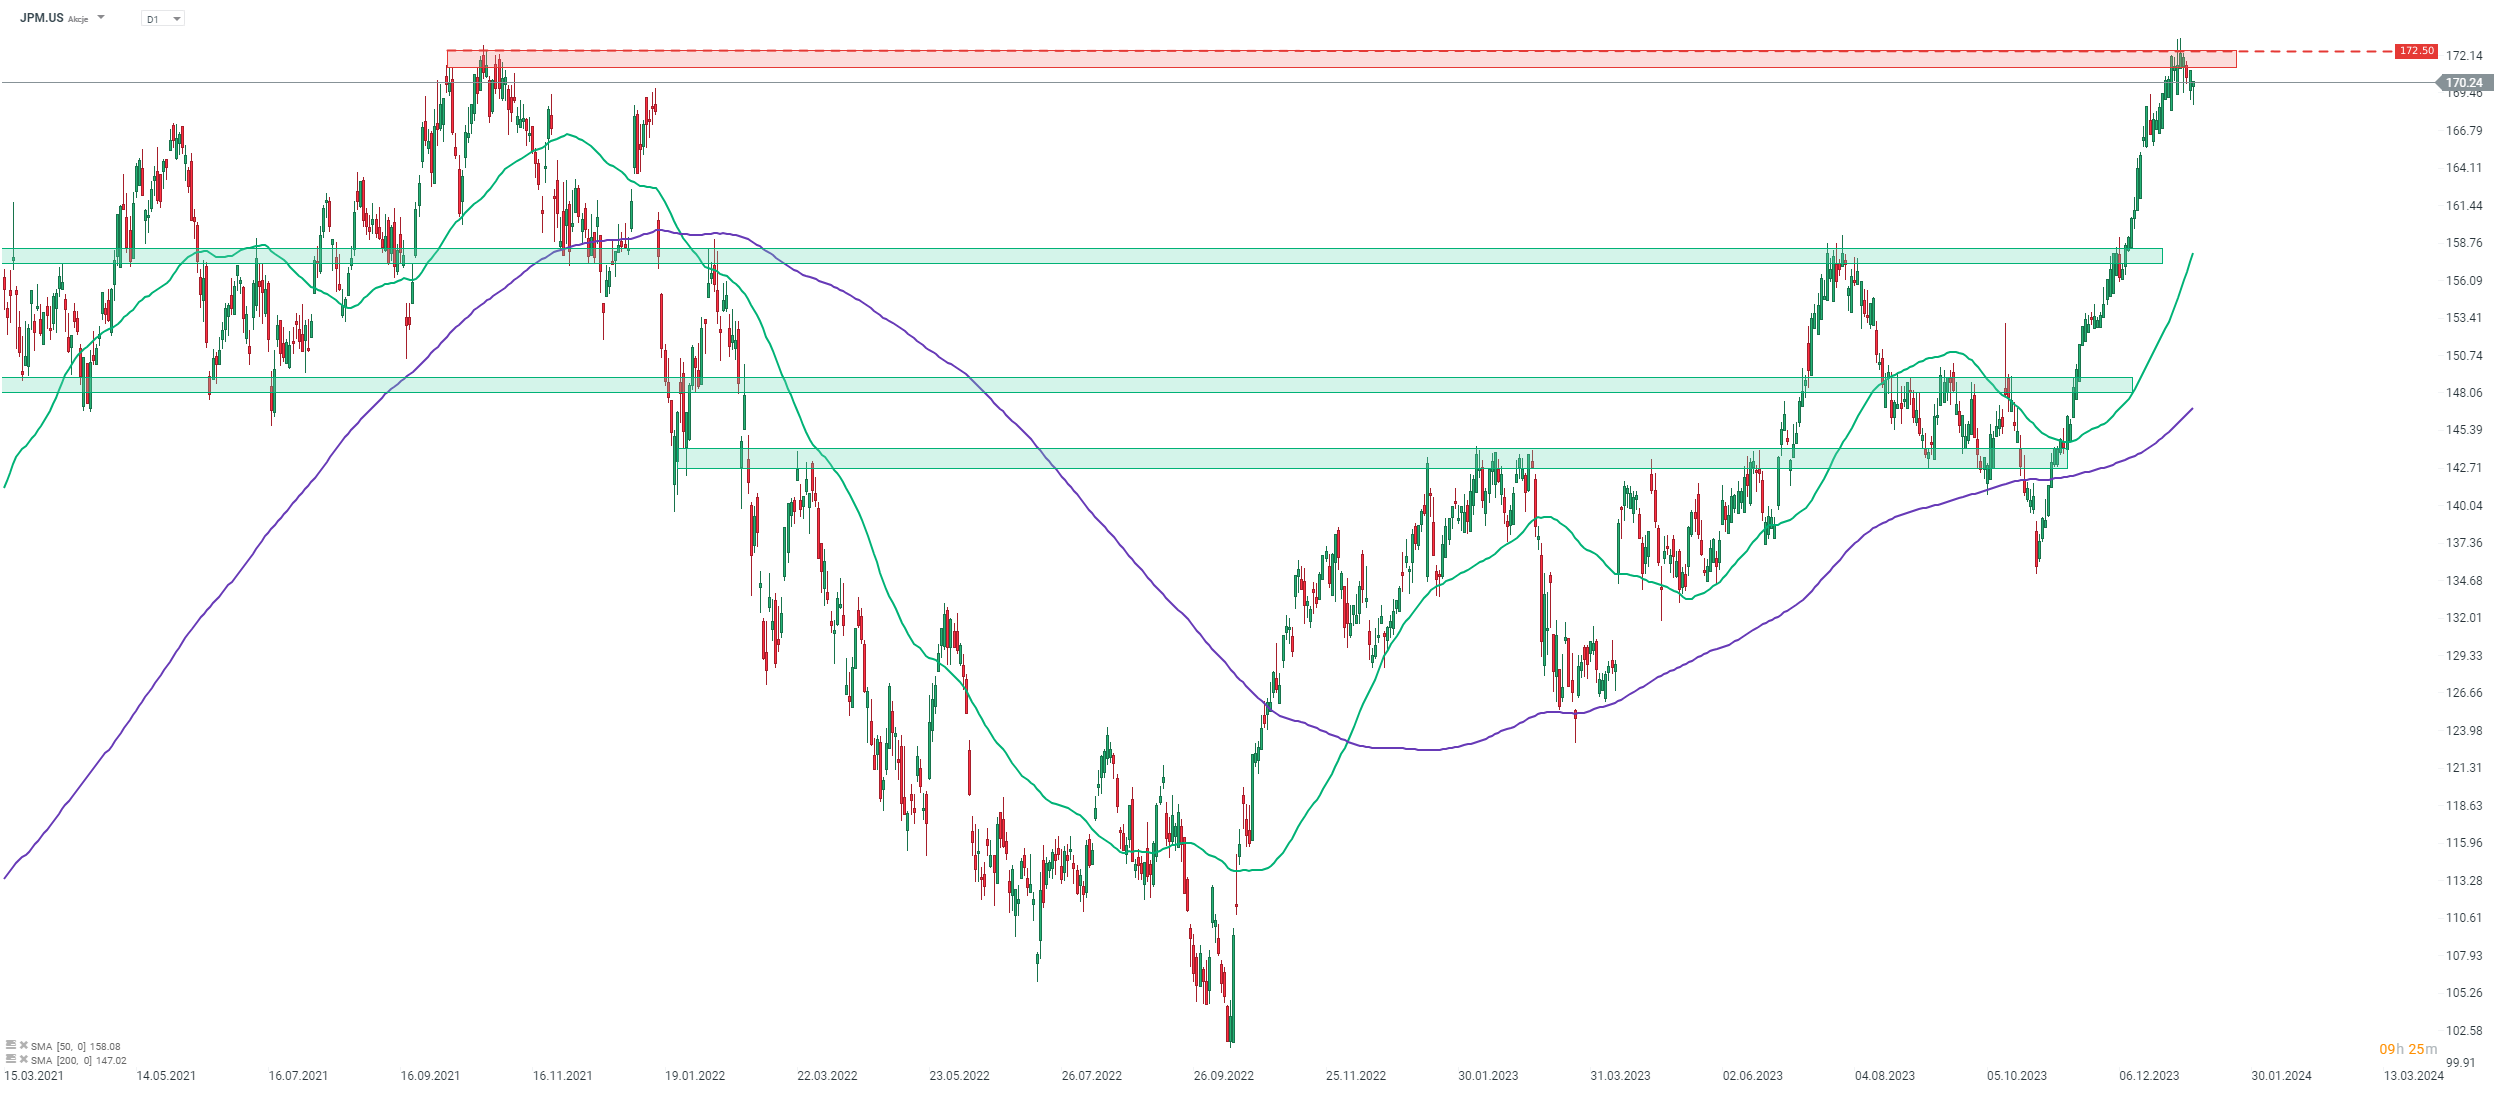
 JPMorgan (JPM.US) gains in pre-market in spite of a miss in Q4 revenue. Stock pulled back recently but continues to trade near $172.50 resistance zone marked with 2021 highs. Source: xStation5
Citigroup
- Revenue: $17.44 billion vs $18.68 billion expected
- Adjusted EPS: $0.84
- Common equity Tier 1 ratio: 13.3% vs 13.6% expected
- Return on average equity: -4.5% vs +1.79% expected
- Net charge-offs: $1.99 billion vs $1.87 billion expected
- Operating expense: $16.0 billion
- Total loans: $689.4 billion vs $671.42 billion expected
- Total deposits: $1.31 trillion
- Efficiency ratio: 91.7%
- Expects full-year revenue at around $80-81 billion
- Expects full-year adjusted expense at around $53.5-53.8 billion
- Citi plans reduction in headcount by 20k over medium term
- Will evaluate buybacks on quarter-by-quarter basis
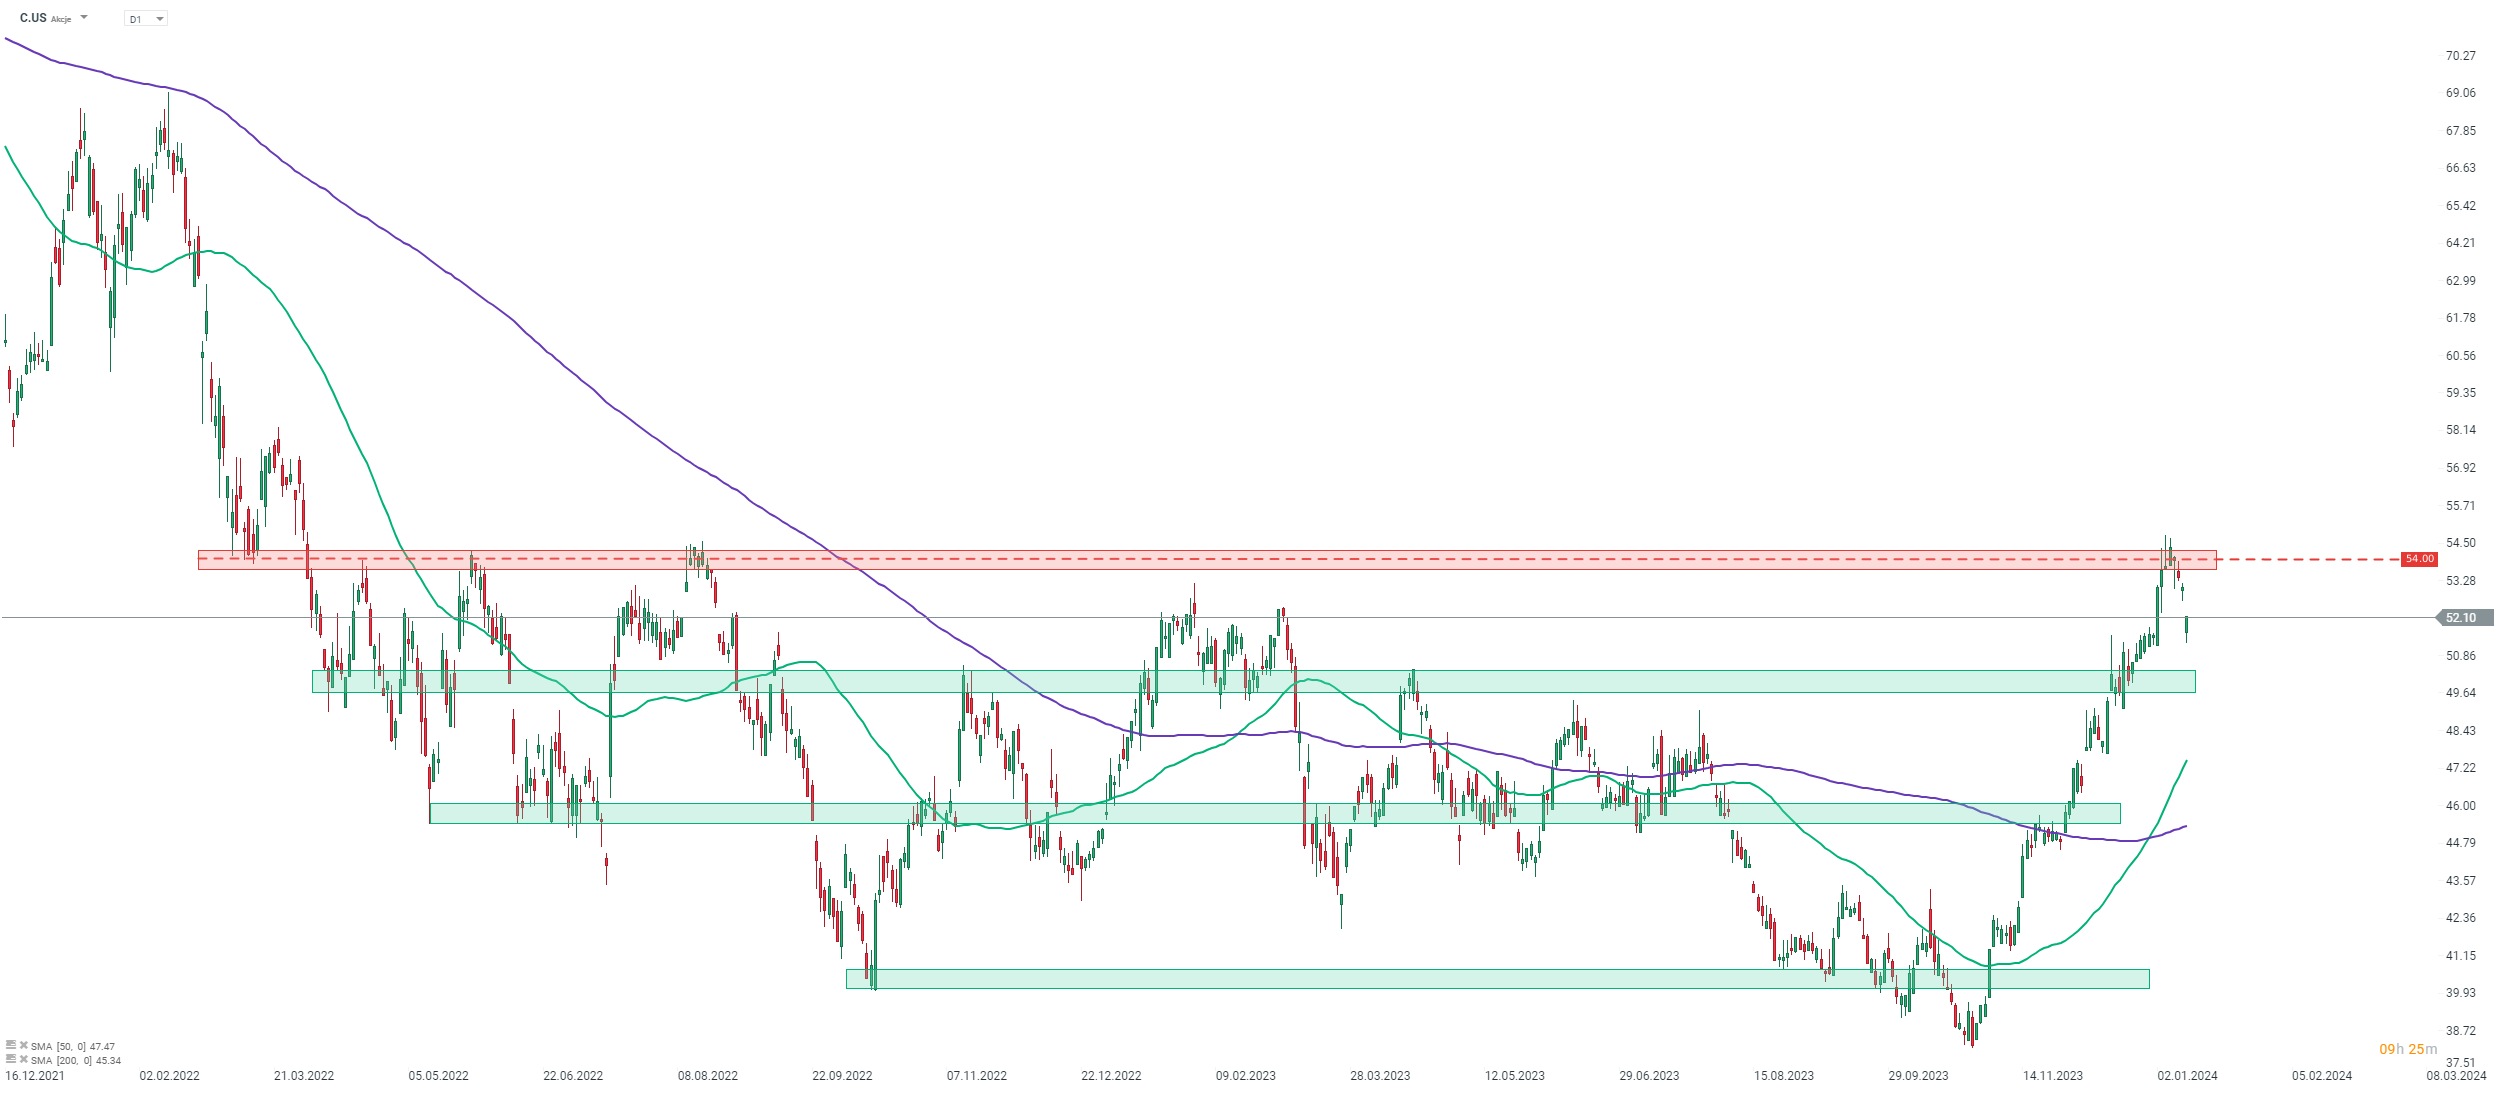
 Citigroup (C.US) gains in premarket in spite of a rather disappointing Q4 earnings. Overall, stock is pulling back, following a failed attempt at breaking above the $54 resistance zone. Source: xStation5

Economic calendar: NFP data and US oil inventory report 💡

Daily summary: Weak US data drags markets down, precious metals under pressure again!

Datadog in Top Form: Record Q4 and Strong Outlook for 2026

US Open: Wall Street rises despite weak retail sales
The content of this report has been created by XTB S.A., with its registered office in Warsaw, at Prosta 67, 00-838 Warsaw, Poland, (KRS number 0000217580) and supervised by Polish Supervision Authority ( No. DDM-M-4021-57-1/2005). This material is a marketing communication within the meaning of Art. 24 (3) of Directive 2014/65/EU of the European Parliament and of the Council of 15 May 2014 on markets in financial instruments and amending Directive 2002/92/EC and Directive 2011/61/EU (MiFID II). Marketing communication is not an investment recommendation or information recommending or suggesting an investment strategy within the meaning of Regulation (EU) No 596/2014 of the European Parliament and of the Council of 16 April 2014 on market abuse (market abuse regulation) and repealing Directive 2003/6/EC of the European Parliament and of the Council and Commission Directives 2003/124/EC, 2003/125/EC and 2004/72/EC and Commission Delegated Regulation (EU) 2016/958 of 9 March 2016 supplementing Regulation (EU) No 596/2014 of the European Parliament and of the Council with regard to regulatory technical standards for the technical arrangements for objective presentation of investment recommendations or other information recommending or suggesting an investment strategy and for disclosure of particular interests or indications of conflicts of interest or any other advice, including in the area of investment advisory, within the meaning of the Trading in Financial Instruments Act of 29 July 2005 (i.e. Journal of Laws 2019, item 875, as amended). The marketing communication is prepared with the highest diligence, objectivity, presents the facts known to the author on the date of preparation and is devoid of any evaluation elements. The marketing communication is prepared without considering the client’s needs, his individual financial situation and does not present any investment strategy in any way. The marketing communication does not constitute an offer of sale, offering, subscription, invitation to purchase, advertisement or promotion of any financial instruments. XTB S.A. is not liable for any client’s actions or omissions, in particular for the acquisition or disposal of financial instruments, undertaken on the basis of the information contained in this marketing communication. In the event that the marketing communication contains any information about any results regarding the financial instruments indicated therein, these do not constitute any guarantee or forecast regarding the future results.


