Shares of leading European container carriers, including Denmark's Maersk (MAERSKA.DK) and Germany's Hapag-Lloyd (HLAG.DE) are losing 7% and 12%, respectively, today, after U.S. dockworkers tentatively signed an agreement suspending a strike until January 15, 2025. Shares of Israeli maritime container carrier ZIM Integrated Shipping (ZIM.US) are also losing nearly 8% before the US open.
- As a result, the market no longer expects a major premium from supply chain bottlenecks, and is selling off shares of container companies that for some time appeared to be potential beneficiaries of the strike.
- We see that since the second half of July, freight rates for a standard 40-foot container have fallen powerfully from nearly $6,000 to around $3,500 today.
- As we see below, 'East-West' rates have been diving almost continuously for the past two months, erasing almost entirely the increases caused by the Red Sea blockade.
- On the one hand, this looks 'disinflationary', on the other hand, it can be interpreted as a signal of a decline in global freight demand, signalling some slowdown in global trade. It is worth noting that rates are extremely sensitive to small changes.
- However Baltic Dry Index, measuring shipping rates for dry bulk commodities such as iron ore, copper, wheat etc. rebounded during the last few weeks, driven by Chinese stimulus and higher, anticipated import activity from China

Source: Drewry
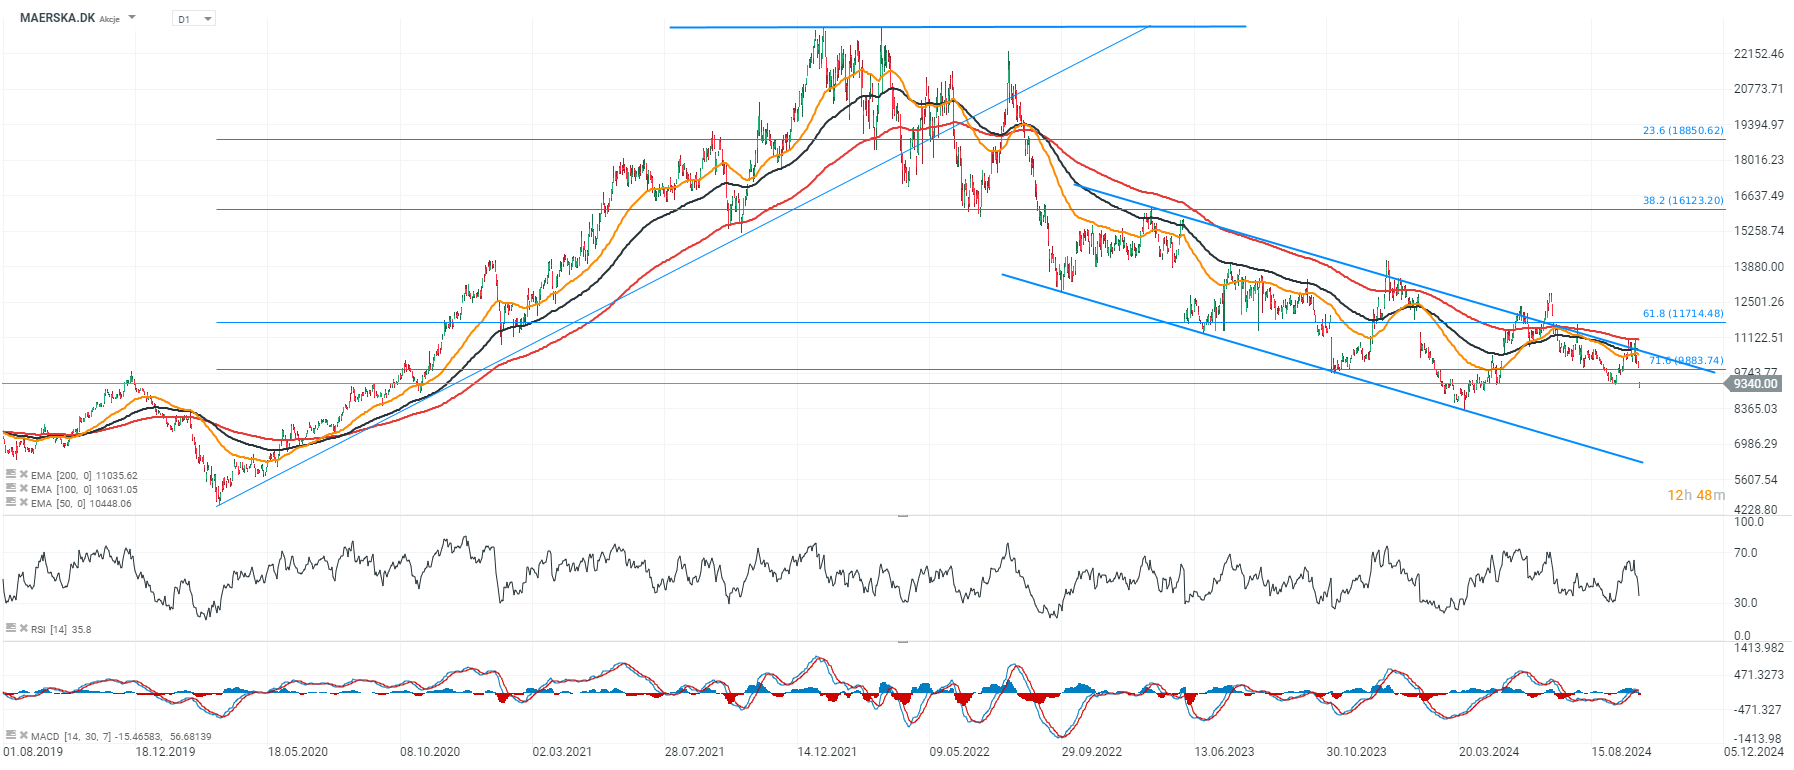
MAERSKA.DK, D1 interval
Maersk shares fell sharply after reaching the upper range of the downward price channel and again failed to overcome the 200-session exponential average. The key support now is around DKK 8,000 per share.
Source: xStation5
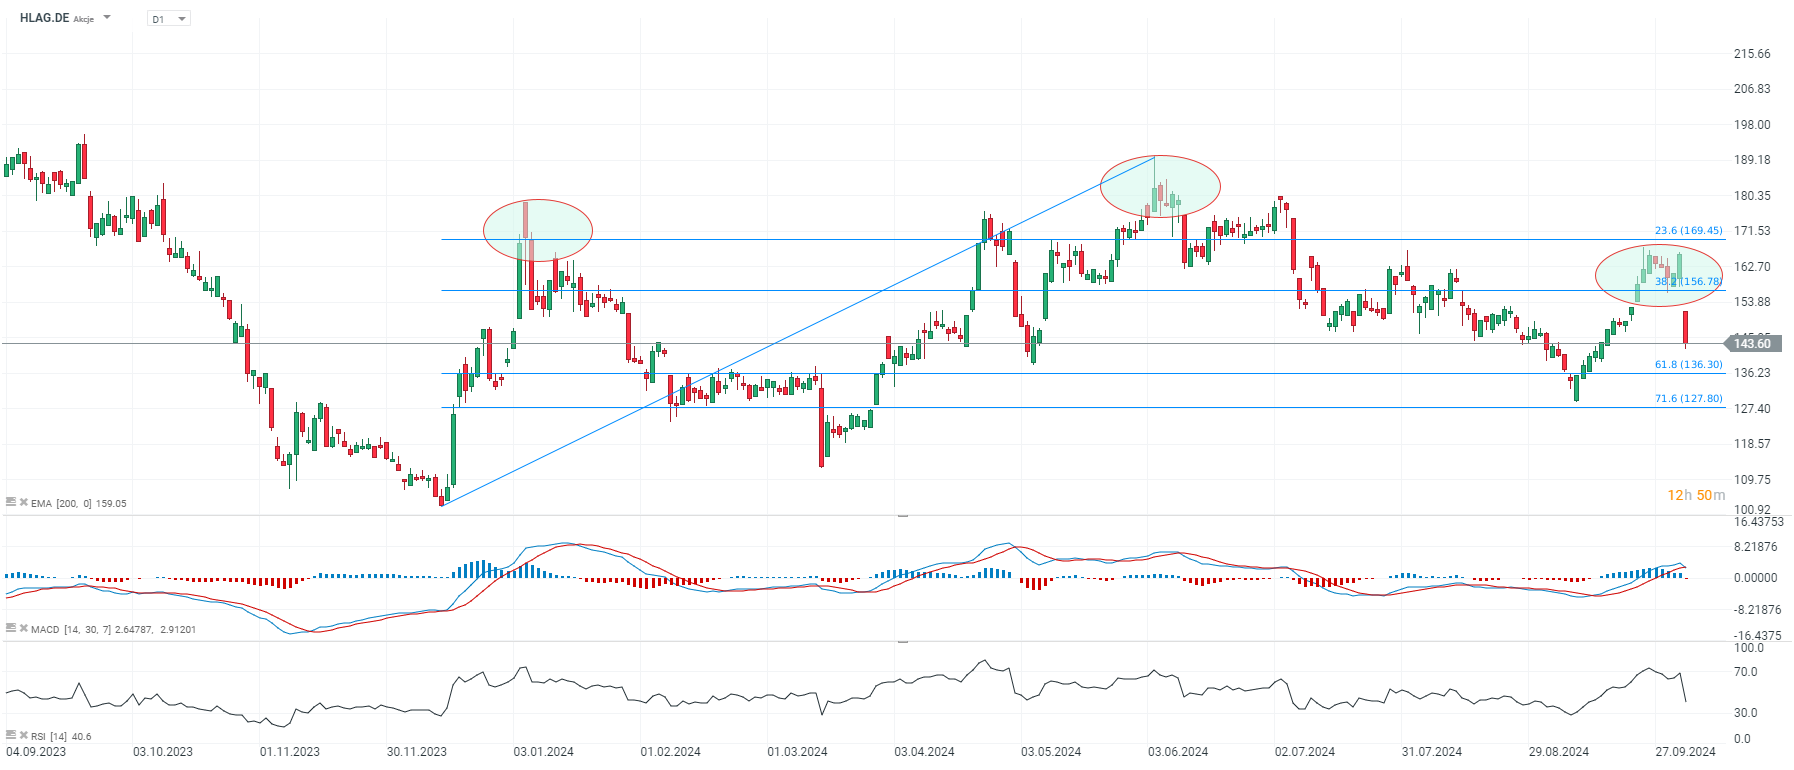
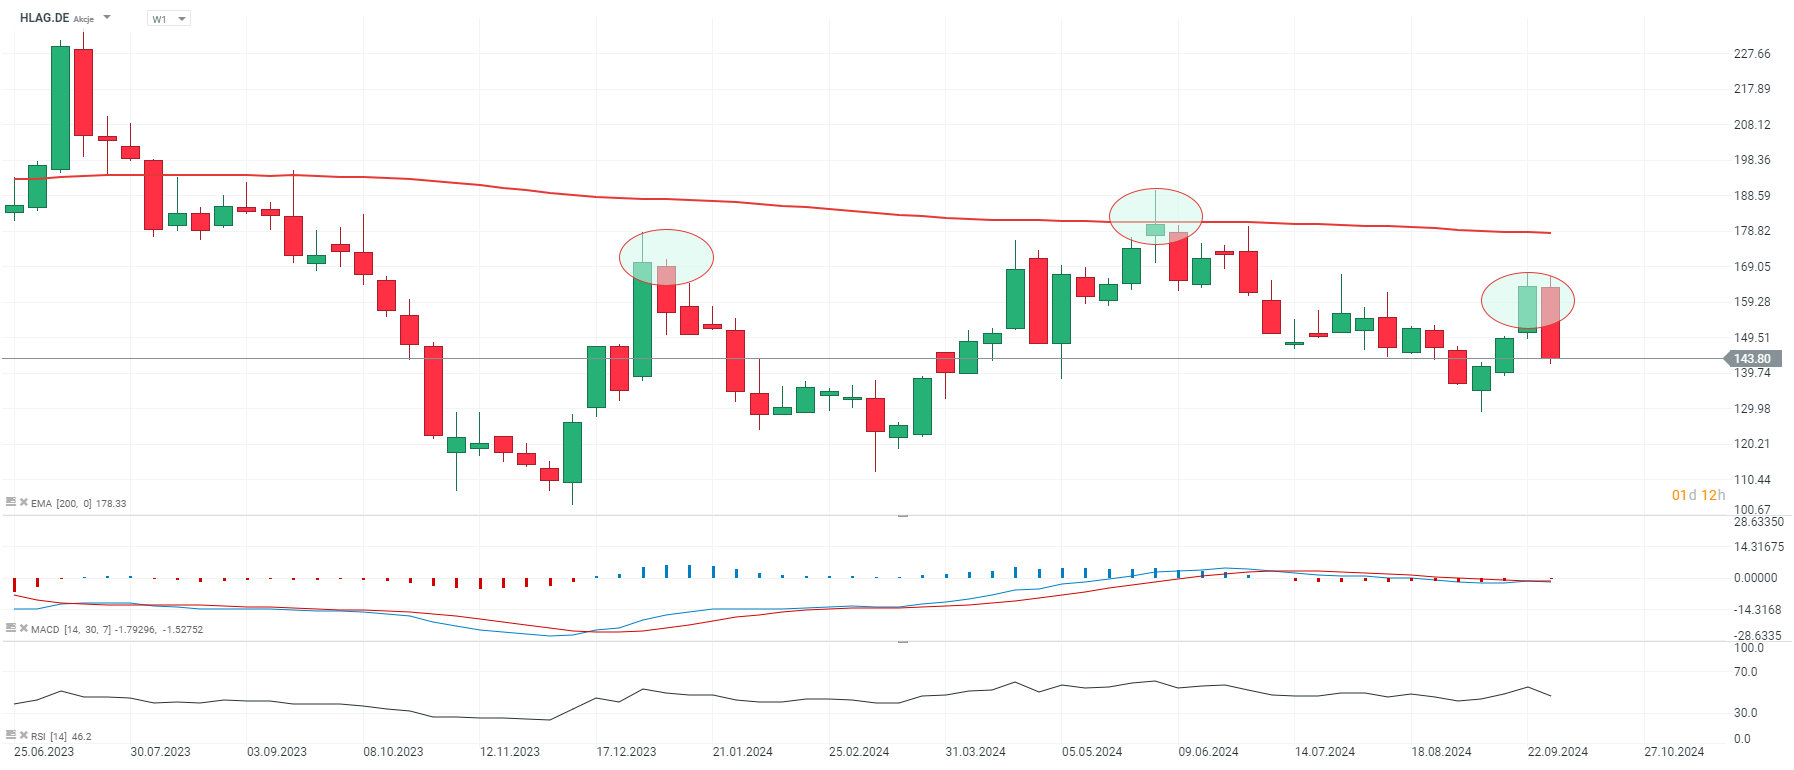
Hapag-Lloyd shares, D1 and W1 interval
Levels between €120 and €135 per share (the neckline in a potential RGR formation) appear to be key for further price reactions.
Source: xStation5
The stock bounced off the 200-session weekly exponential moving average (EMA200, red line); we may see a potentially bearish price formation, resembling a head-and-shoulders (RGR).
Source: xStation5

ملخص اليوم: بيانات أمريكية ضعيفة تُؤدي إلى انخفاض الأسواق، والمعادن الثمينة تتعرض لضغوط مجدداً!

شركة داتادوغ في أفضل حالاتها: ربع رابع قياسي وتوقعات قوية لعام 2026"

الولايات المتحدة: ارتفاع وول ستريت رغم ضعف مبيعات التجزئة

أرباح شركة كوكاكولا: هل سيصمد الرئيس التنفيذي الجديد أمام الضغوط؟


