Read more
10:49 AM · 6 October 2020

❗ Technical alert: GOLD 🥇

-
-
Open account Download free app

Looking at the gold market on H4 interval, one can see that the price is once again testing the key resistance area. The zone marked with a purple colour on the screen below results from the upper limit of 1:1 structure and previous price reactions. According to the classic technical analysis, as long as the price sits below the $1,915, continuation of the downward move looks possible. However, one should keep in mind that the chance of breaking above increases with each subsequent test.

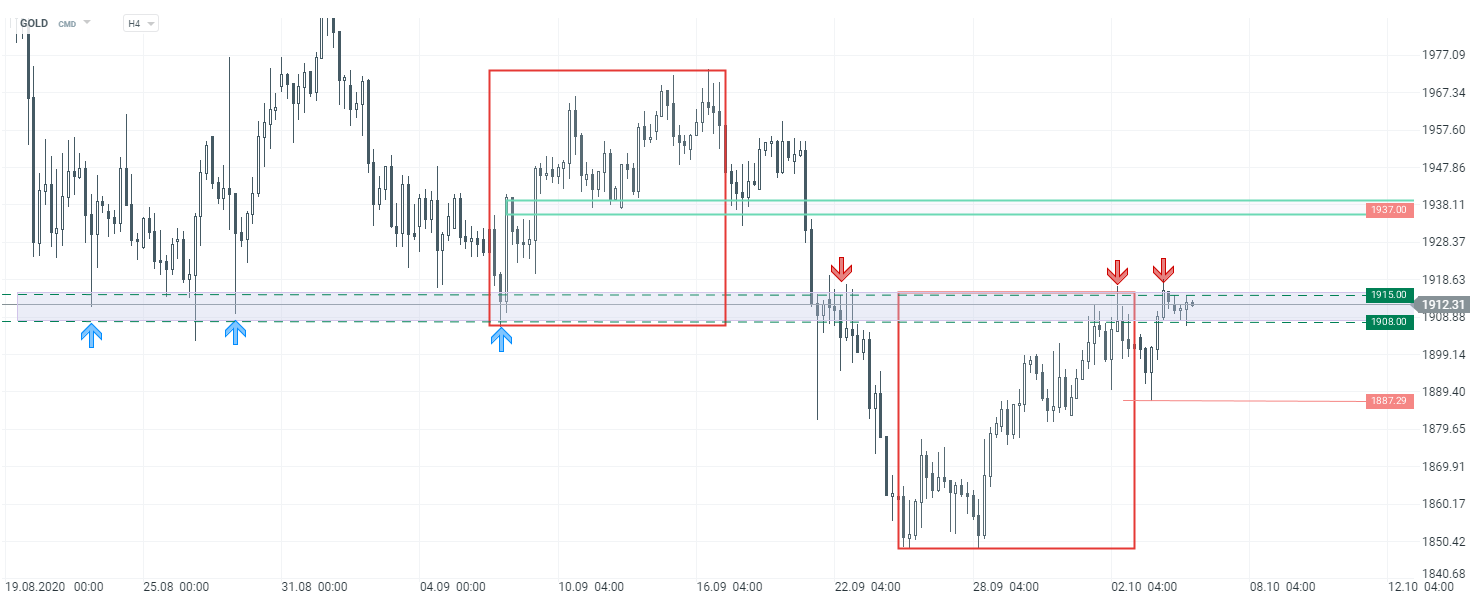
GOLD H4 interval. Source: xStation5

9 February 2026, 8:50 AM

NATGAS slides 6% on shifting weather forecasts

6 February 2026, 5:22 PM

Three markets to watch next week (09.02.2026)

6 February 2026, 2:51 PM

Geopolitical Briefing (06.02.2026): Is Iran Still a Risk Factor?

6 February 2026, 12:38 PM

Silver surges 5% 📈

Join over 2 000 000 XTB Group Clients from around the world
The financial instruments we offer, especially CFDs, can be highly risky. Fractional Shares (FS) is an acquired from XTB fiduciary right to fractional parts of stocks and ETFs. FS are not a separate financial instrument. The limited corporate rights are associated with FS.
This page was not created for investors residing in Brazil. This brokerage is not authorized by the Comissão de Valores Mobiliários (CVM) or the Brazilian Central Bank (BCB). The content of this page should not be characterized as an investment offer in Brazil or for investors residing in that country.
Losses can exceed deposits