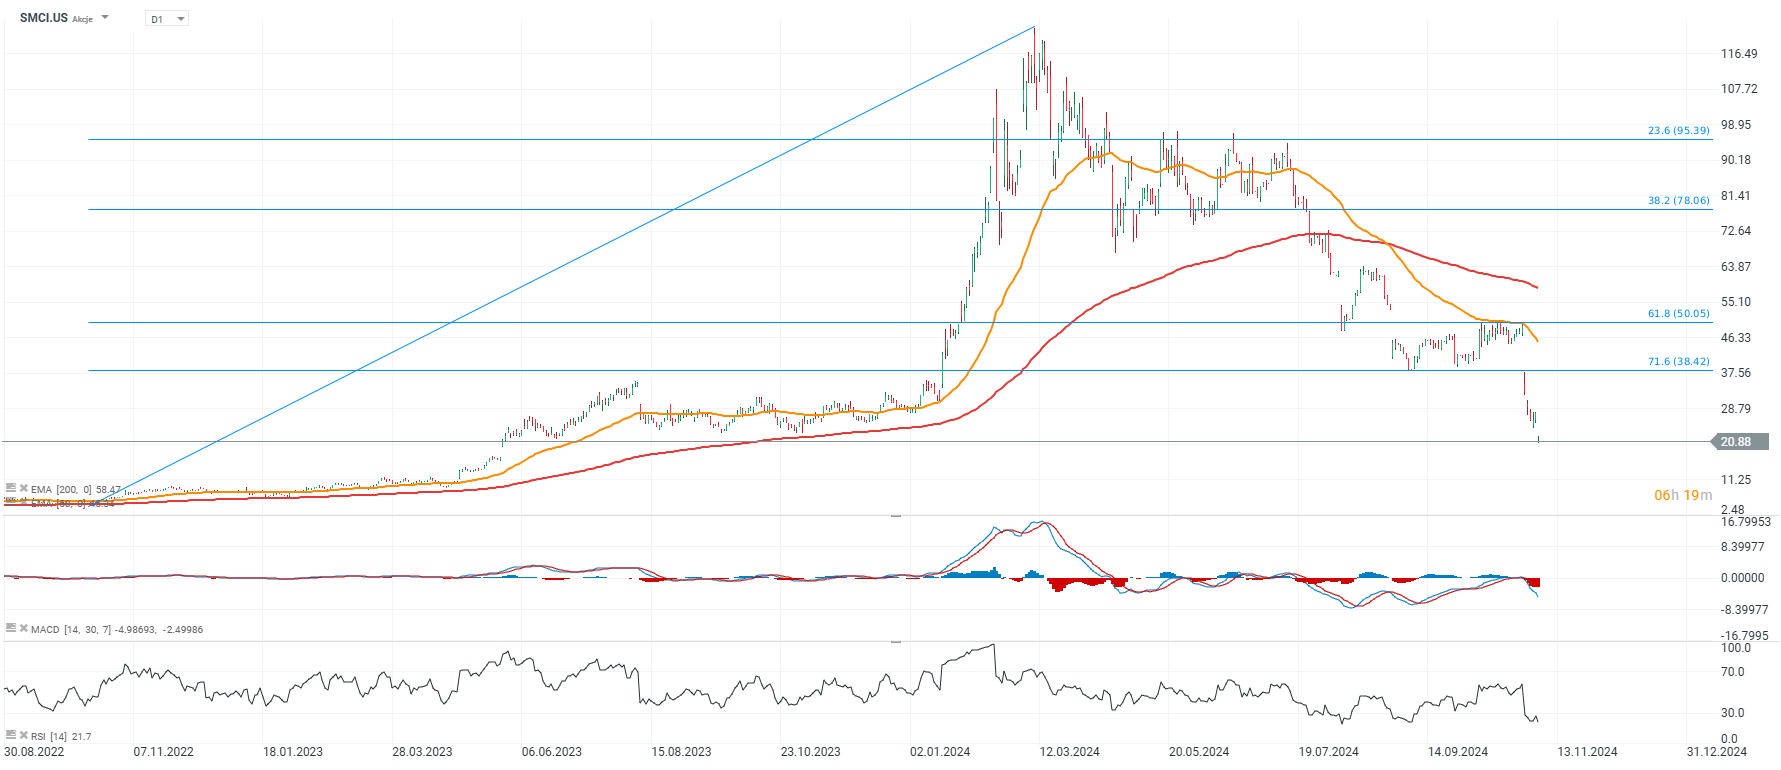
Shares of server racks producer Super Micro Computer (SMCI.US) are down 23% today, and are now on the levels unseen since May 2023, as markets weigh in weaker results, pressured future guidance and fraud risk with further uncertainty among the listing in S&P 500 and Nasdaq indices.
- While revenue slightly missed expectations, the EPS and margin guidance show resilience in operational efficiency. The Q2 guidance suggests continued conservative expectations, likely reflecting market conditions or client purchasing trends, yet the company’s focus on cost control and cash management remains evident.
- The Board of Directors commented that no any fraud or misconduction was detected in analyzed financial documents. The company claims that its relationship with Nvidia is still deep and expect further developments amid AI Blackwell chip debut.
- Here are the highlights and insights from Super Micro Computer, Inc.'s preliminary earnings report for fiscal Q1 FY 2025 (quarter ended in September 2024).
-
Net Sales:
- Expected in the range of $5.9 billion to $6.0 billion, which is below the prior guidance range of $6.0 billion to $7.0 billion. This indicates a slight shortfall in revenue, likely influenced by softer-than-expected demand or a delay in customer purchasing patterns.
-
Margins:
- GAAP and Non-GAAP Gross Margin: Approximately 13.3%, reflecting steady performance on cost management. Non-GAAP Adjustments: Includes a $4 million add-back for stock-based compensation, pointing to their proactive steps in managing operating expenses.
-
Net Income per Share:
- GAAP Net Income: Estimated between $0.68 to $0.70, slightly above the midpoint of the previous guidance of $0.60 to $0.77.
- Non-GAAP Net Income: Expected between $0.75 to $0.76, which is above the midpoint of prior guidance of $0.67 to $0.83.
- Despite the revenue shortfall, the EPS figures slightly outperform midpoint expectations, likely benefiting from cost controls or efficient assets' allocation.
-
Cash and Debt Position:
- Total Cash and Equivalents: Approximately $2.1 billion with total debt at $2.3 billion, with $0.6 billion in bank debt and $1.7 billion in convertible notes.
- The cash-to-debt ratio reflects a highly leveraged position, with cash covering just under its debt obligations. This balance might impact future flexibility, particularly if interest rates rise or earnings growth softens.
Weaker than expected guidance (fiscal Q2 2025 ending December 31, 2024)
-
Net Sales:
- Expected to range from $5.5 billion to $6.1 billion, signaling possible seasonal softness or cautious outlook on demand in the near term. Wall Street expected $6.86 billion.
-
Earnings per Share Guidance:
- GAAP Net Income: Projected to be $0.48 to $0.58. Analysts were looking for EPS of $0.83.
- Non-GAAP Net Income: Projected between $0.56 to $0.65, excluding stock-based compensation expenses of $54 million and other expenses, net of related tax effects.
- This guidance implies potential earnings pressure in Q2, which may point to ongoing cost containment strategies. The guidance is clearly weaker than for Q1 2025
Comments about security concerns: The Special Committee has today provided the following statement to Super Micro, but has not otherwise provided any additional details or information."The Special Committee has completed its investigation based on a set of initial concerns raised by EY. Following a three-month investigation led by Independent Counsel, the Committee’s investigation to date has found that the Audit Committee has acted independently and that there is no evidence of fraud or misconduct on the part of management or the Board of Directors. The Committee is recommending a series of remedial measures for the Company to strengthen its internal governance and oversight functions, and the Committee expects to deliver the full report on the completed work this week or next. The Special Committee has other work that is ongoing but expects it to be completed soon."
SMCI chart (D1 interval)

Source: xStation5

Daily summary: Silver plunges 9% 🚨Indices, crypto and precious metals under pressure

Does the current sell-off signal the end of quantum companies?

Howmet Aerospace surges 10% after earnings reaching $100 bilion market cap 📈

US Open: Cisco Systems slides 10% after earnings 📉 Mixed sentiments on Wall Street


