- European finished session higher
- US jobless claims lowest since March 2020
- US oil inventories rise the most since March
- Ethereum price soars 5%
European indices finished today’s session higher after better-than-expected earnings reports lifted market sentiment despite ongoing worries about rising inflation. Strong bank earnings from Citigroup, Wells Fargo, Bank of America, Morgan Stanley topped analysts’ estimates and propelled stocks globally. US indexes rose sharply at the beginning of the session as economic data provided additional support with initial jobless claims falling to a new pandemic-low of 293k and producer inflation rising less than expected. Still some investors believe that inflation is already structural, and the Fed does not want to admit it. This is why the central bank is likely to move towards normalizing monetary policy, even if employment growth slows down.
Oil price rose around 0.80% and WTI crude is trying to break above $80.00 per barrel after an EIA report showed US crude oil inventories increased by 6.088 million barrels, well above analysts' projections of a 0.702 million rise. It was the third straight weekly gain and the biggest build since the week ended March 5th. The strong increase in crude oil inventories and the decrease in gasoline inventories result from a very large drop in processing capacity. Gold price continues to rise and tested the $ 1,800 level thanks to a weak dollar and lower bond yields. Silver gains over 1.6% and is trading around $23.40.
Mixed moods prevails on the cryptocurrency market. Bitcoin jumped above $58,000 early in the session however buyers failed to uphold momentum and price pulled back to $57,000. Meanwhile Ethereum and other altcoins moved higher. Price of the second most popular cryptocurrency rallied more than 5% and is currently approaching $3800 level.
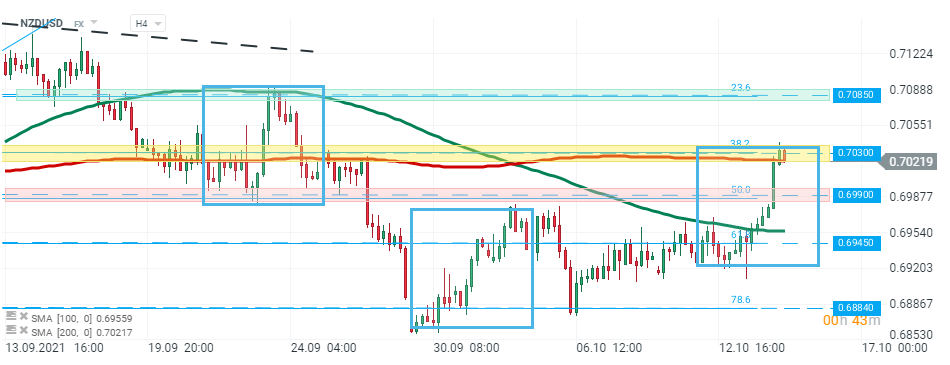
 NZDUSD pair rose sharply during today’s session and is currently testing a major resistance zone around 0.7030 which is marked with upper limit of the 1:1 structure, 200 SMA (red line) and 38.2% Fibonacci retracement of the last upward wave. Should break higher occur, upward move may accelerate towards next resistance at 0.7085 which coincides with 23.6% Fibonacci retracement. On the other hand, if sellers manage to regain control, support at 0.6990 may be at risk. Source: xStation5

Daily Summary - Powerful NFP report could delay Fed rate cuts

BREAKING: Massive increase in US oil reserves!

US OPEN: Blowout Payrolls Signal Slower Path for Rate Cuts?

BREAKING: US100 jumps amid stronger than expected US NFP report


