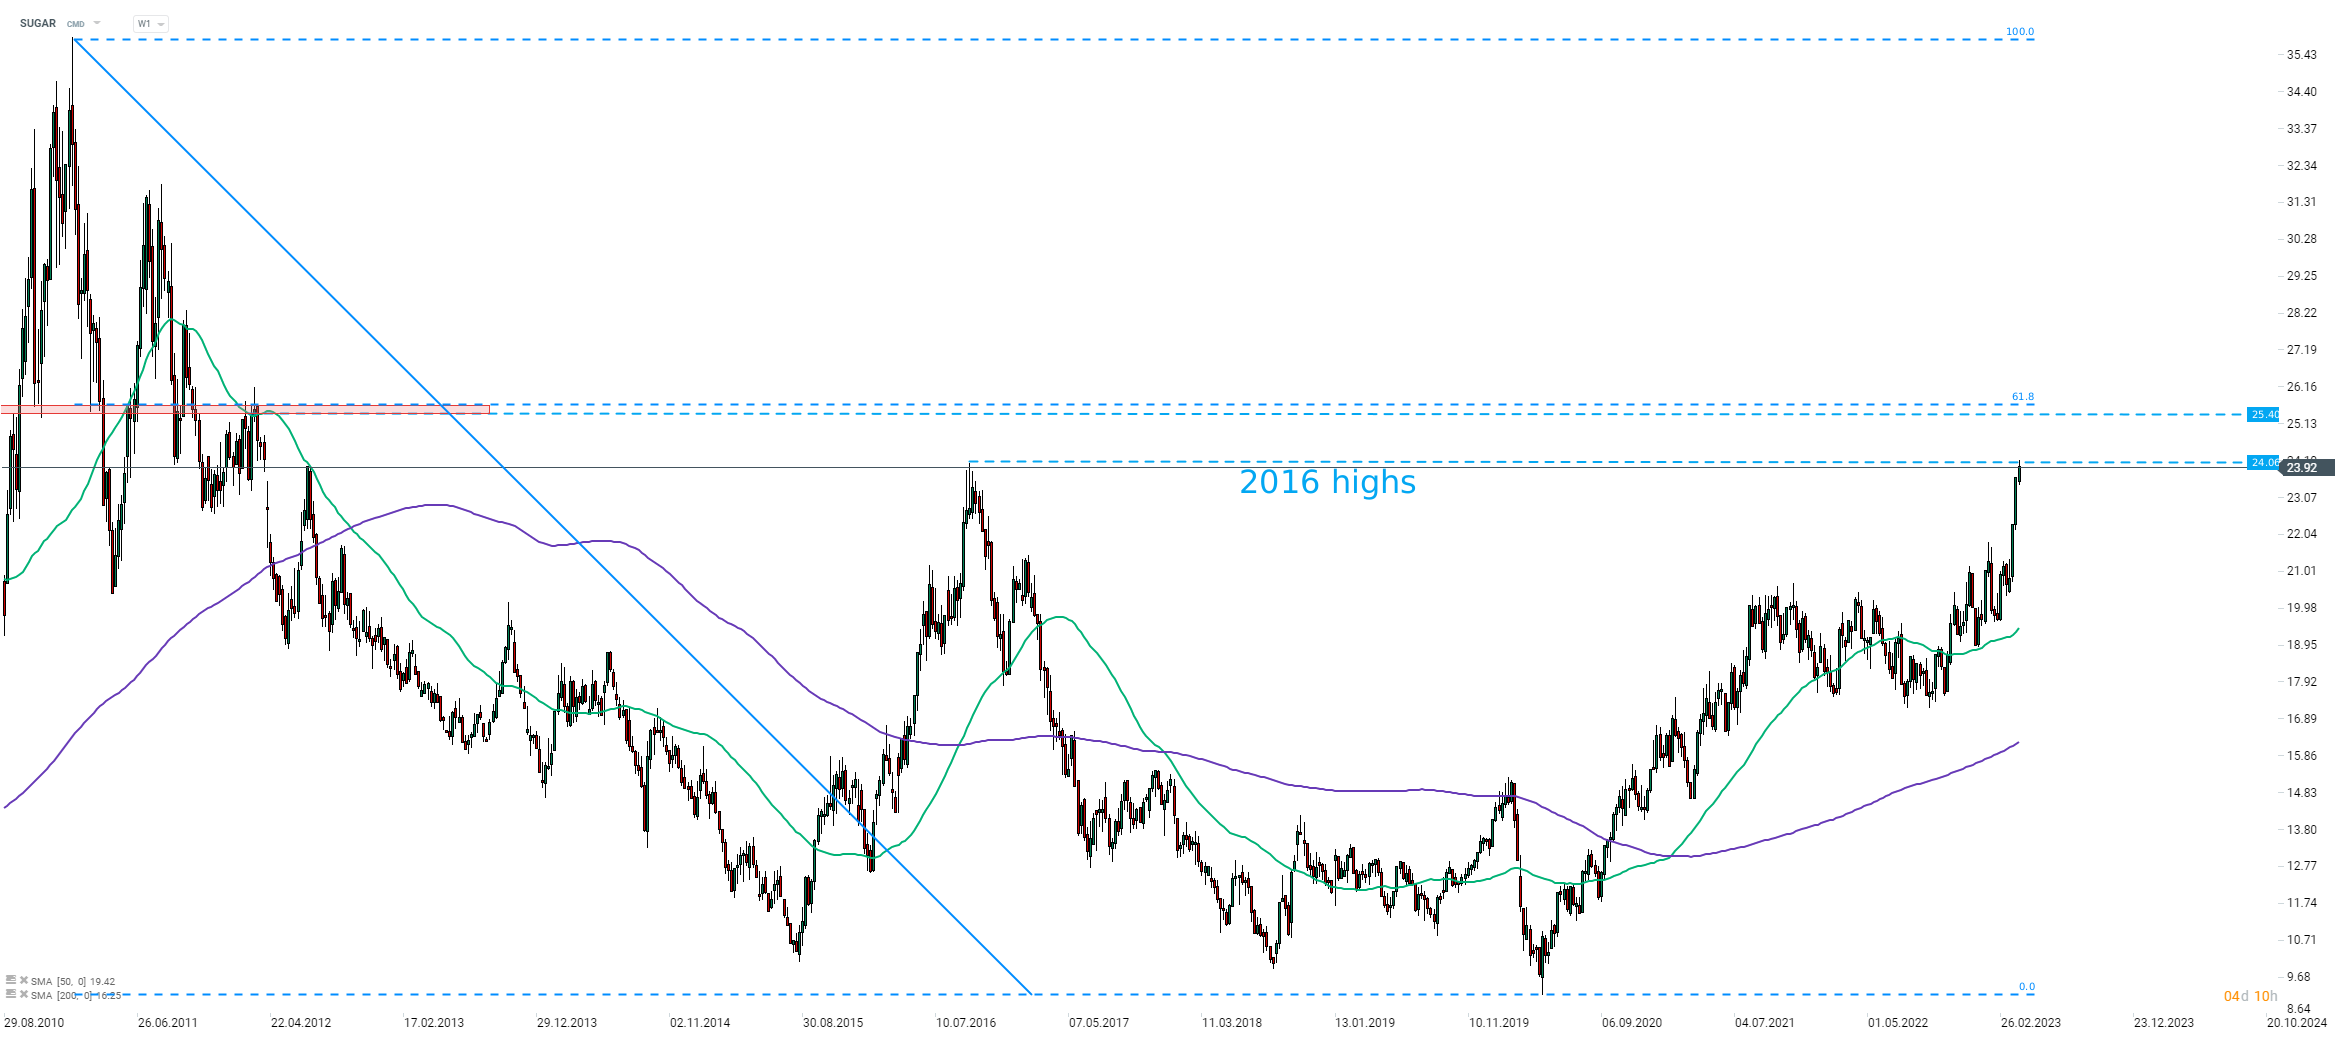
Beginning of a new week is very positive for sugar bulls. SUGAR is trading 2% higher today and managed to break above the $24.06 per pound level, marking a 2016 high. As a result, price found itself briefly trading at the highest level since April 2012 - a 11-year high. A strong upward impulse launched at the end of March is driven by price-positive fundamentals.
While Brazil began harvest and is expected to harvest bumper crop this year, concerns are mounting over supply from Asia, especially India and Thailand, in early-2024 as production outlook for the region has been lowered recently. This is also driving concerns that the Indian government will not allow for increased sugar exports this season. Attention is also on El Nino phenomenon, which is expected to bring drier weather. Note that a dry El Nino in 2015/2016 season led to a massive spike in sugar prices. Last but not least, recent jump in oil prices may cause producers to be more willing to divert more sugarcane for biofuel production rather than for sugar production.
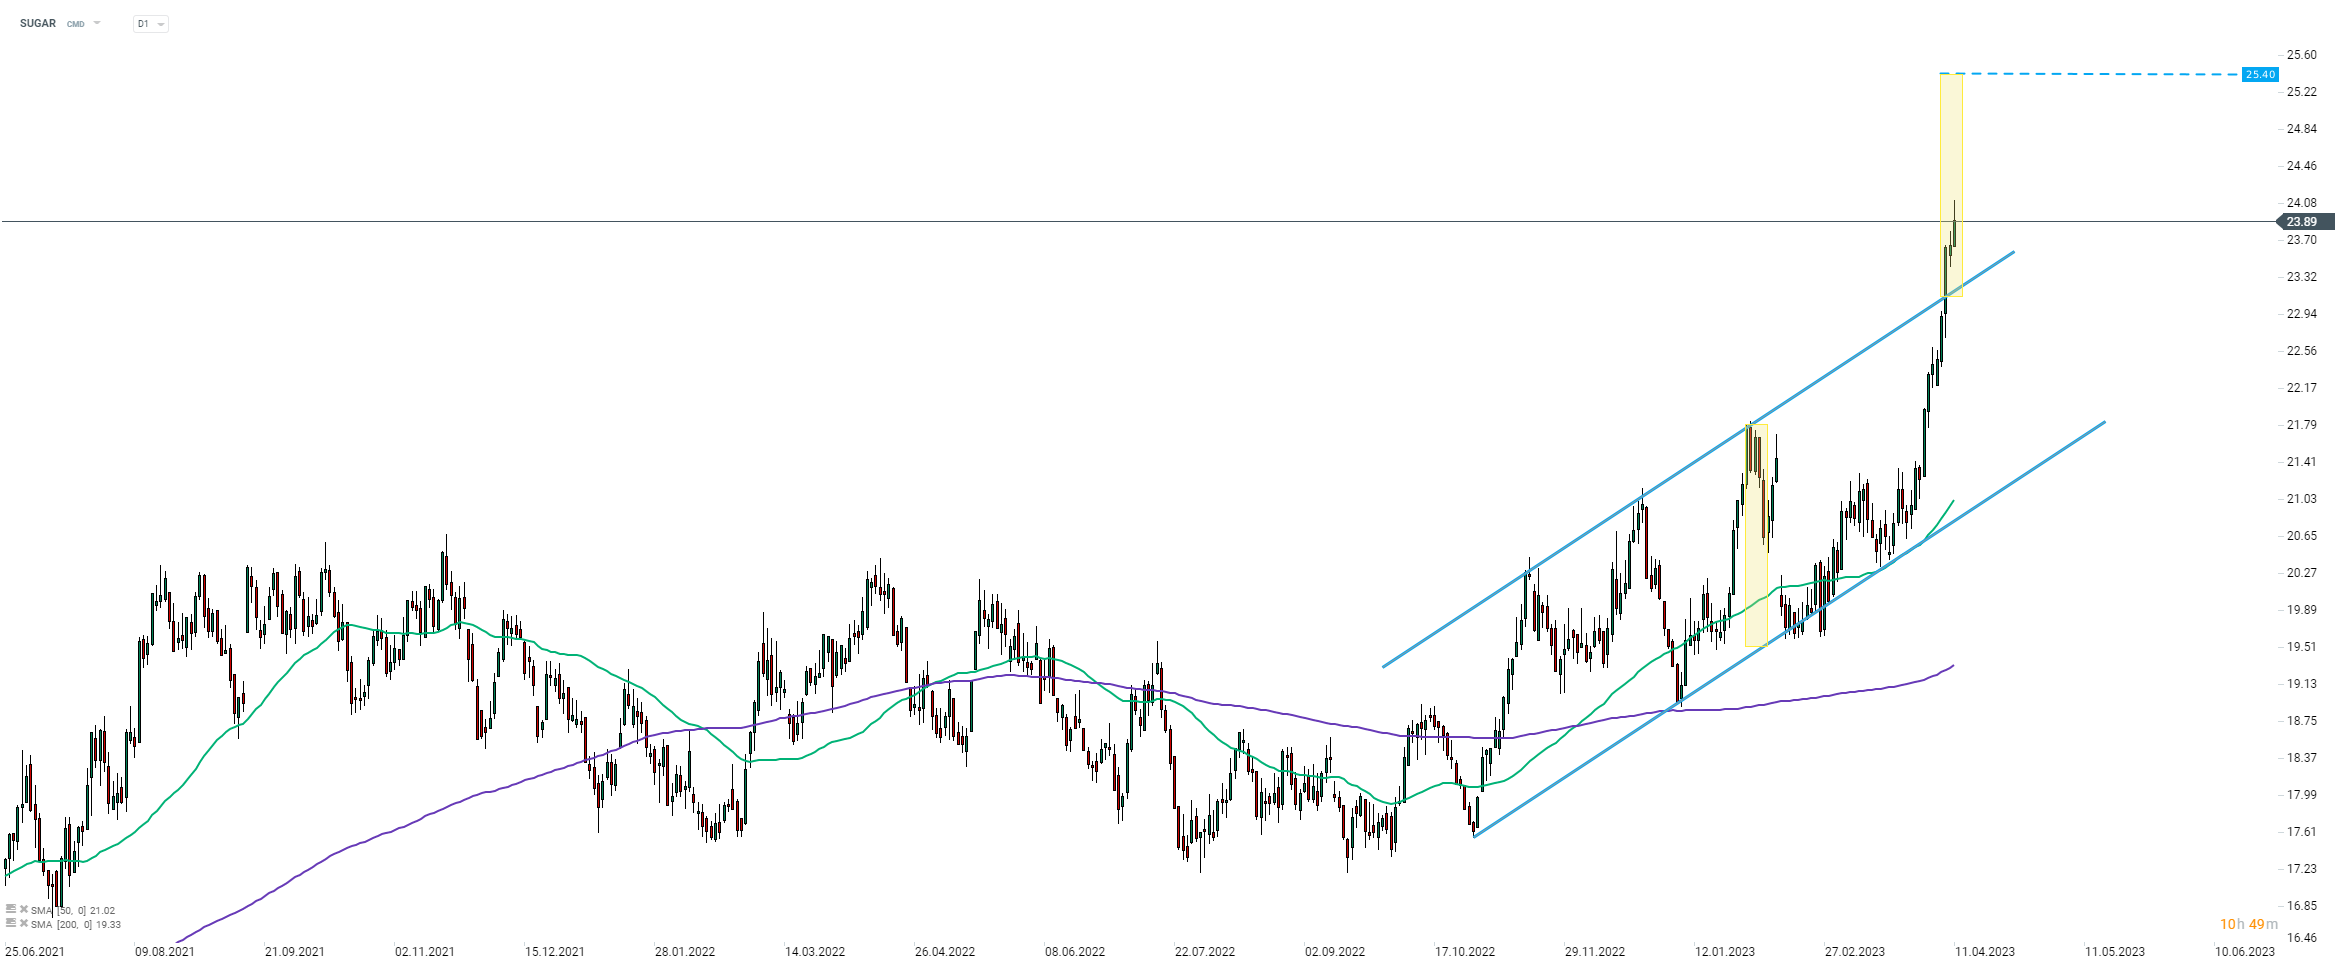
Taking a look at SUGAR at D1 interval (first chart below), we can see that the price has recently broke above the upper limit of the upward channel. According to classic technical analysis, upside breakout may lead to a price rally similar in size to the width of the channel. Should it be executed in a textbook manner, price may climb to the 25.40 area. A look at the chart at W1 interval (second chart below), shows that the area between 25.40 mark and 61.8% retracement of the downward move launched in 2011 could be a resistance level to watch as it saw some price reactions in the 2010-2012 period.
 SUGAR at D1 interval. Source: xStation5

SUGAR at W1 interval. Source: xStation5

Daily summary: Weak US data drags markets down, precious metals under pressure again!

NATGAS slides 6% on shifting weather forecasts

Three markets to watch next week (09.02.2026)

Geopolitical Briefing (06.02.2026): Is Iran Still a Risk Factor?


