
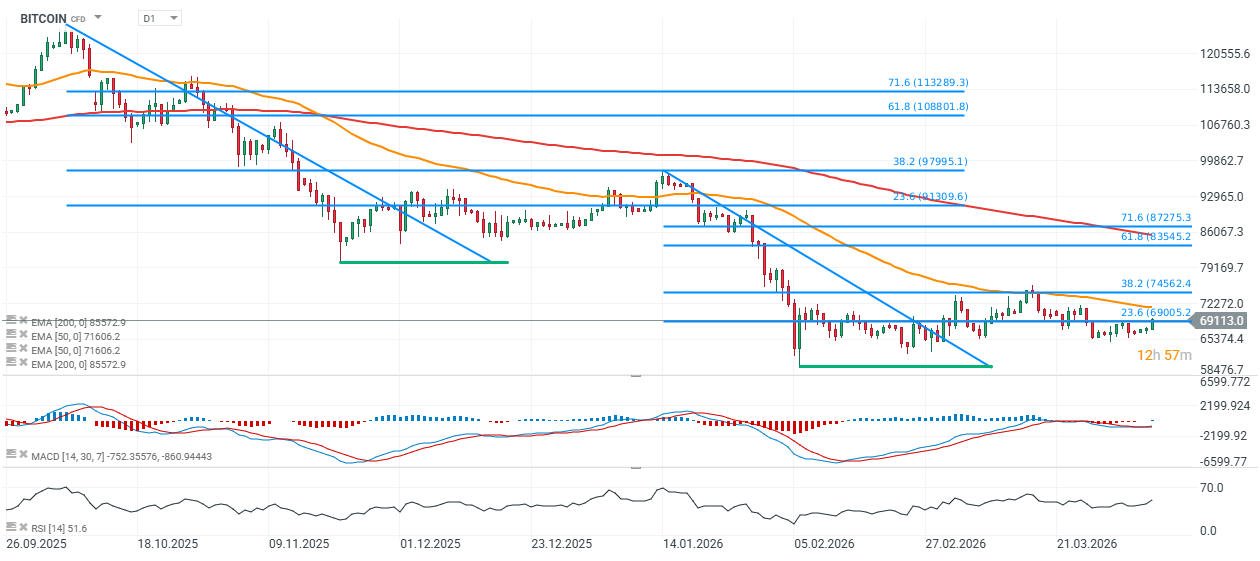
Bitcoin chart (D1 timeframe)
Looking at the last two downward price impulses, BTC has behaved similarly in both cases. Currently, as well as at the turn of November and December 2025, the price declined by around 10% below the 23.6% Fibonacci retracement of the downward move—previously around $91,000, and currently near $69,000. As in the previous move, the price has also rebounded from resistance at the 38.2% Fibonacci retracement - earlier around $98,000, and now approximately $74,600.
The key support level is currently located around $65,000. A break below this threshold could trigger a decisive third downward impulse. If such a move were to mirror the scale of the previous two declines (roughly 1:1), Bitcoin could potentially fall toward the $45,000 area. On the other hand, upward move above $70k makes the retest of $74.600 more probable.
Source: xStation5

Daily Summary - Crude oil below $100 amid ceasefire

BREAKING: Outdated "hawkish" minutes fail to move the dollar

➡️EURUSD below 1.17 ahead of FOMC Minutes

BREAKING: Another build in oil inventories, decline in fuel stocks