Technical analysis is widely used by investors and traders all over the globe. There are many technical formations and indicators, but it’s worth starting with the basics because their simplicity could be their strength.
Formations can be divided into reversal patterns and continuation patterns. In this article, we present two reversal patterns and one continuation. All three patterns can be used across forex, indices, or commodities.
Double Bottom/Double Top
Double bottom/top is one of the best-known reversal patterns. It is simple but powerful - there is a second low in the double bottom that doesn’t go lower or a second high in a double top that does not go higher.
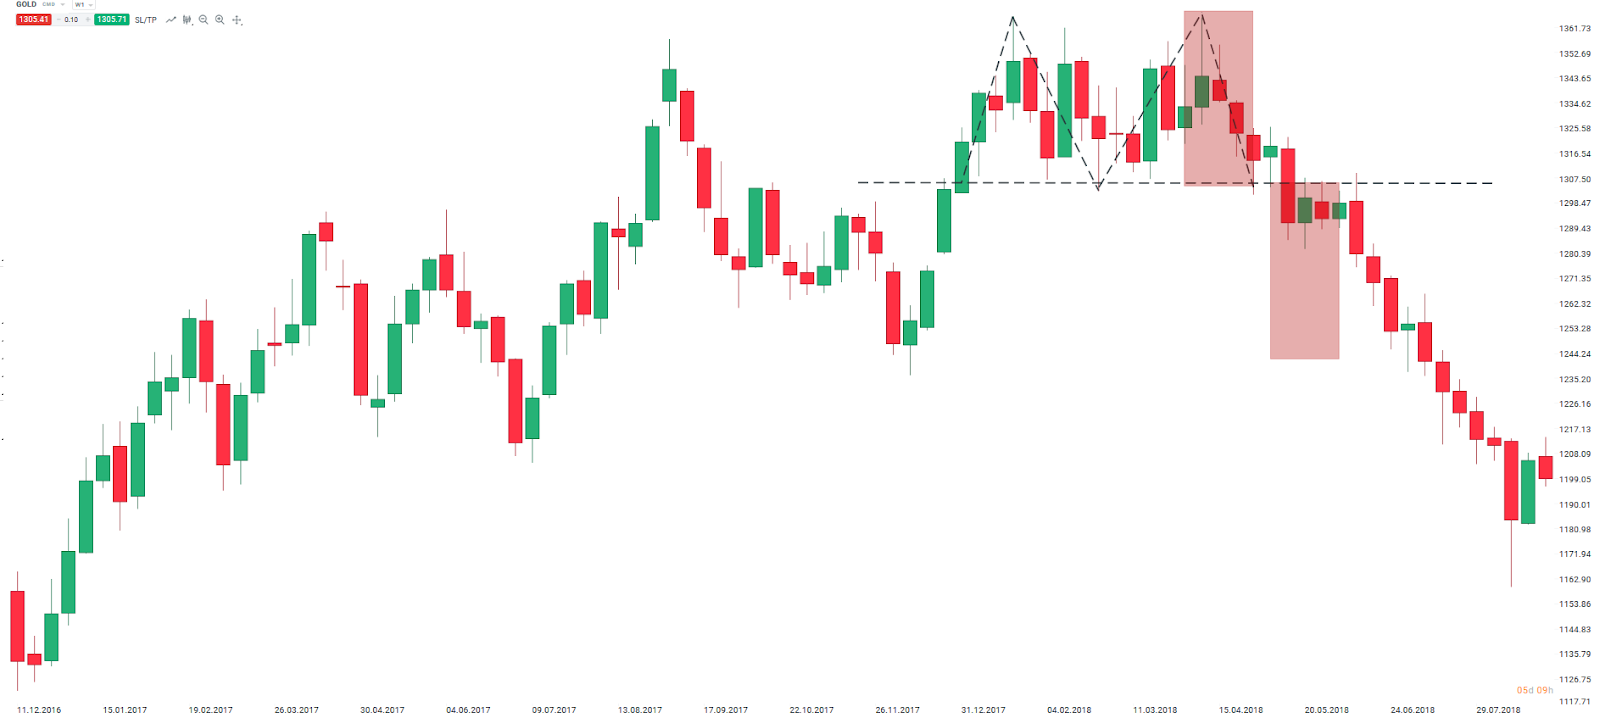
When this pattern forms, it indicates fatigue in the trend and signals that a reversal could be more likely. The double bottom resembles the letter W, while the double top letter resembles an M. If the top of a W or bottom of an M is broken by the price, the trend can be reversed. It is normally assumed that a range of future price movement is at least equal to the height of W or M.
 In this case, the range of formation far exceeded the height of M, and the formation actually marked the start of the new trend. Source: xStation 5
Please be aware that the presented data refers to the past performance data and such is not a reliable indicator of future performance.
Head and Shoulders
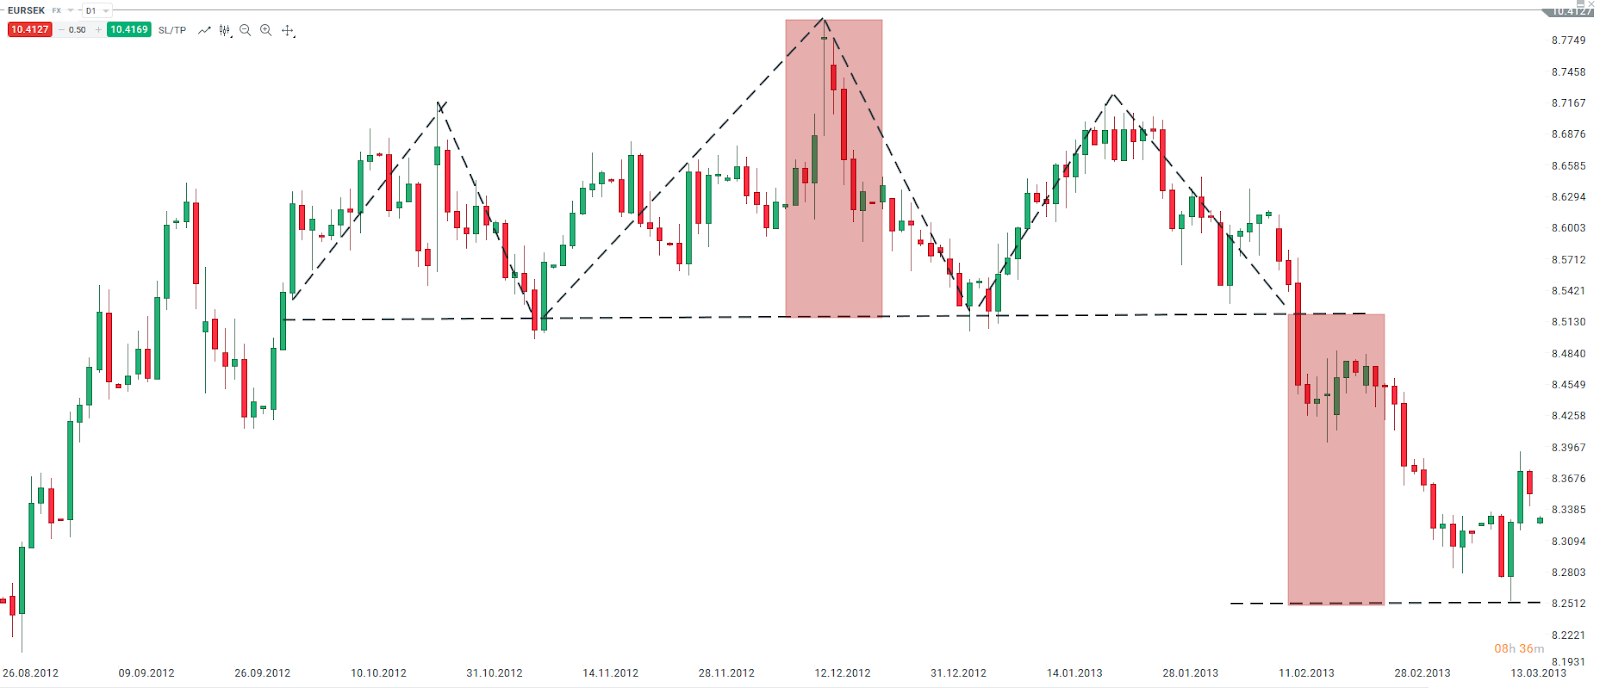
The head and shoulders pattern is similar to the double top as in both situations the buyers are unable to push prices to the higher high, and this heralds a trend reversal. In this case, highs 1 and 3 are lower and are called shoulders; while the high 2 is at the top of the trend and is called the head.
Highs 1 and 3 should be at a similar level. Lows between highs are just as important as they should be around the same level too. These lows create a neckline that plays a fundamental part. Once price breaks through the neckline, it triggers the formation. The textbook range is the distance between the neckline and the head. There is also a reverse head and shoulders formation that marks a reverse of a downward trend - it works exactly in the same way, just in the opposite direction.
 Head and shoulders formation on the EURSEK. One can see that it worked in a textbook fashion. Please be aware that the presented data refers to the past performance data, and as such is not a reliable indicator of future performance. Source: xStation 5
Wedge
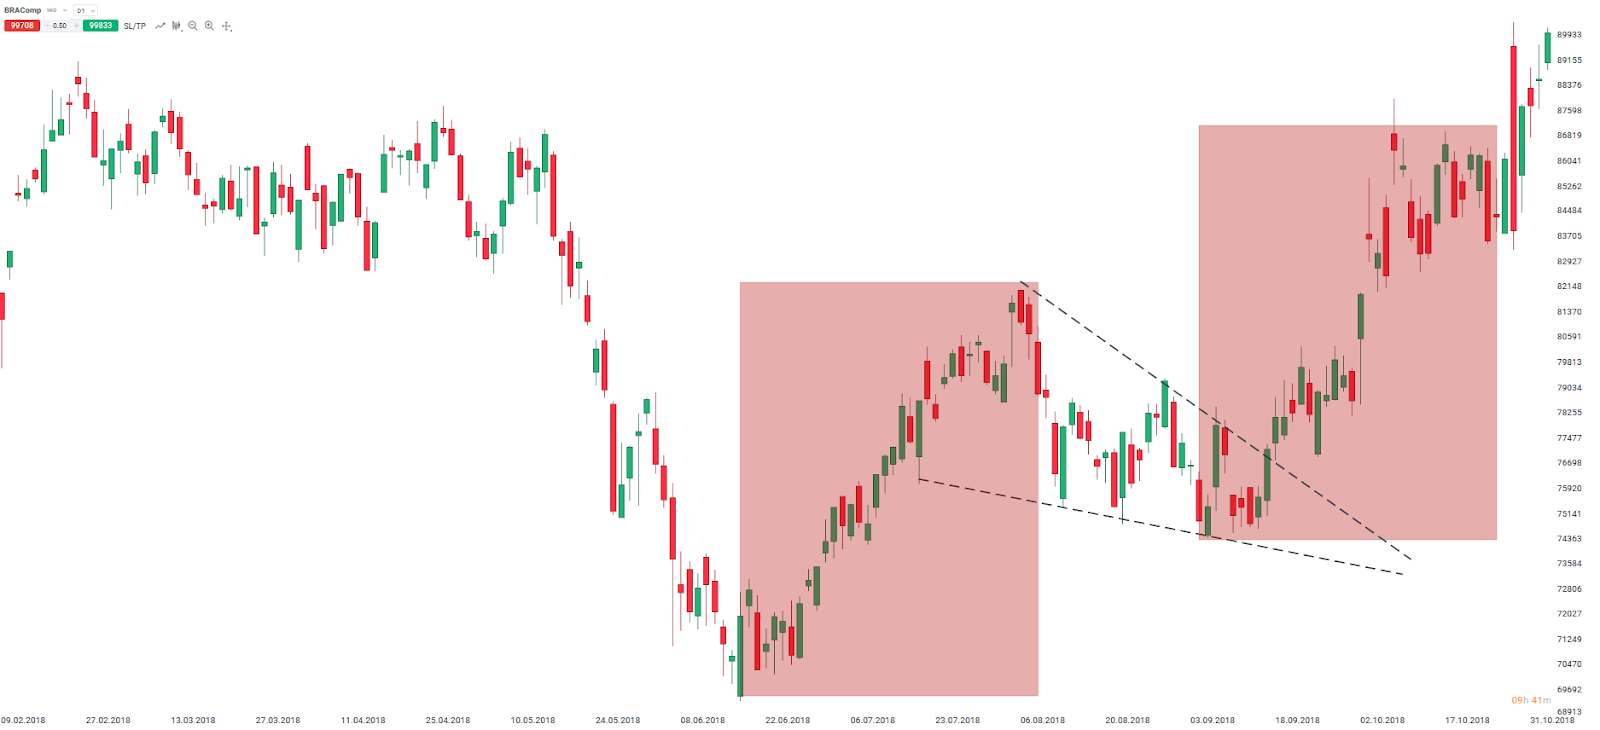
Unlike the previous two, the wedge is a continuation pattern. The wedge itself is a form of price correction following a rapid impulse move. Price amplitude declines within the wedge and when it breaks out of it, another impulse move - in the same direction to the first one - should take place. We can distinguish a downward wedge that separates upward impulses and an upward wedge that separates downward impulses. The idea here is that a declining volatility within the wedge shows lack of interest among market participants to pursue the direction of the wedge and eventually the original trend is resumed.
 A downward wedge on BRAComp was just a correction between the two price rallies. Please be aware that the presented data refers to the past performance data and such is not a reliable indicator of future performance. Source: xStation 5


